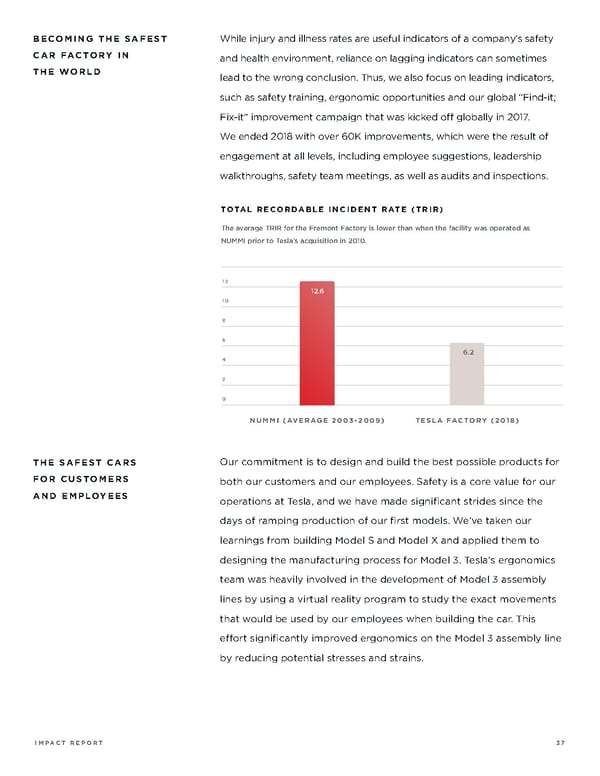
BECOMING THE SAFEST While injury and illness rates are useful indicators of a company’s safety CAR FACTORY IN and health environment, reliance on lagging indicators can sometimes THE WORLD lead to the wrong conclusion. Thus, we also focus on leading indicators, such as safety training, ergonomic opportunities and our global “Find-it; Fix-it” improvement campaign that was kicked o! globally in 2017. We ended 2018 with over 60K improvements, which were the result of engagement at all levels, including employee suggestions, leadership walkthroughs, safety team meetings, as well as audits and inspections. TOTAL RECORDABLE INCIDENT RATE (TRIR) The average TRIR for the Fremont Factory is lower than when the facility was operated as NUMMI prior to Tesla’s acquisition in 2010. 12 12.6 10 8 6 6.2 4 2 0 NUMMI (AVERAGE 2003-2009) TESLA FACTORY (2018) THE SAFEST CARS Our commitment is to design and build the best possible products for FOR CUSTOMERS both our customers and our employees. Safety is a core value for our AND EMPLOYEES operations at Tesla, and we have made significant strides since the days of ramping production of our first models. We’ve taken our learnings from building Model S and Model X and applied them to designing the manufacturing process for Model 3. Tesla’s ergonomics team was heavily involved in the development of Model 3 assembly lines by using a virtual reality program to study the exact movements that would be used by our employees when building the car. This e!ort significantly improved ergonomics on the Model 3 assembly line by reducing potential stresses and strains. IMPACT REPORT 37
 Tesla Impact Report | 2019 Page 36 Page 38