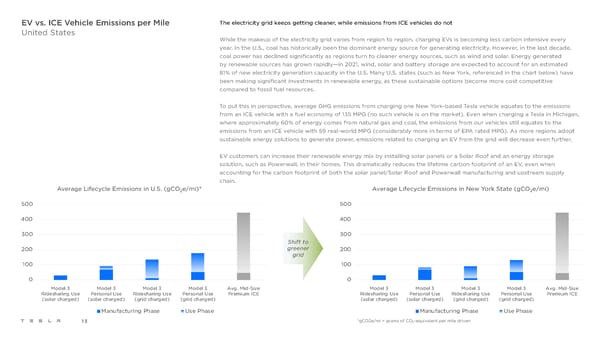
EV vs. ICE Vehicle Emissions per Mile The electricity grid keeps getting cleaner, while emissions from ICE vehicles do not United States While the makeup of the electricity grid varies from region to region, charging EVs is becoming less carbon intensive every year. In the U.S., coal has historically been the dominant energy source for generating electricity. However, in the last decade, coal power has declined significantly as regions turn to cleaner energy sources, such as wind and solar. Energy generated byrenewable sources has grown rapidly—in 2021, wind, solar and battery storage are expected to account for an estimated 81% of new electricity generation capacity in the U.S. Many U.S. states (such as New York, referenced in the chart below) have been making significant investments in renewable energy, as these sustainable options become more cost competitive compared to fossil fuel resources. To put this in perspective, average GHG emissions from charging one New York-based Tesla vehicle equates to the emissions from an ICE vehicle with a fuel economy of 135 MPG (no such vehicle is on the market). Even when charging a Tesla in Michigan, where approximately 60% of energy comes from natural gas and coal, the emissions from our vehicles still equates to the emissions from an ICE vehicle with 59 real-world MPG (considerably more in terms of EPA rated MPG). As more regions adopt sustainable energy solutions to generate power, emissions related to charging an EV from the grid will decrease even further. EV customers can increase their renewable energy mix by installing solar panels or a Solar Roof and an energy storage solution, such as Powerwall, in their homes. This dramatically reduces the lifetime carbon footprint of an EV, even when accounting for the carbon footprint of both the solar panel/Solar Roof and Powerwall manufacturing and upstream supply chain. Average Lifecycle Emissions in U.S. (gCO e/mi)* Average Lifecycle Emissions in New York State (gCO e/mi) 2 2 500 500 400 400 300 300 Shift to 200 greener 200 grid 100 100 0 0 Model 3 Model 3 Model 3 Model 3 Avg. Mid-Size Model 3 Model 3 Model 3 Model 3 Avg. Mid-Size Ridesharing Use Personal Use Ridesharing Use Personal Use Premium ICE Ridesharing Use Personal Use Ridesharing Use Personal Use Premium ICE (solar charged) (solar charged) (grid charged) (grid charged) (solar charged) (solar charged) (grid charged) (grid charged) Manufacturing Phase Use Phase Manufacturing Phase Use Phase *gCO2e/mi = grams of CO -equivalent per mile driven 13 2
 Tesla Impact Report 2020 Page 12 Page 14