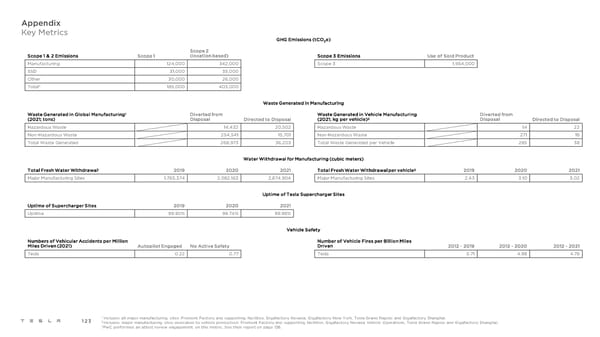
Appendix Key Metrics GHG Emissions (tCO2e) Scope 2 Scope 1 & 2 Emissions Scope 1 (location based) Scope 3 Emissions Use of Sold Product Manufacturing 124,000 342,000 Scope 3 1,954,000 SSD 31,000 35,000 Other 30,000 26,000 Total* 185,000 403,000 Waste Generated in Manufacturing Waste Generated in Global Manufacturing1 Diverted from Waste Generated in Vehicle Manufacturing Diverted from 2 (2021; tons) Disposal Directed to Disposal (2021; kg per vehicle) Disposal Directed to Disposal Hazardous Waste 14,432 20,502 Hazardous Waste 14 22 Non-Hazardous Waste 254,541 15,701 Non-Hazardous Waste 271 16 Total Waste Generated 268,973 36,203 Total Waste Generated per Vehicle 285 38 Water Withdrawal for Manufacturing (cubic meters) 1 2 Total Fresh Water Withdrawal 2019 2020 2021 Total Fresh Water Withdrawal per vehicle 2019 2020 2021 Major Manufacturing Sites 1,765,374 2,082,163 2,874,904 Major Manufacturing Sites 2.43 3.10 3.02 Uptime of Tesla Supercharger Sites Uptime of Supercharger Sites 2019 2020 2021 Uptime 99.90% 99.74% 99.96% Vehicle Safety Numbers of Vehicular Accidents per Million Number of Vehicle Fires per Billion Miles Miles Driven (2021) Autopilot Engaged No Active Safety Driven 2012 - 2019 2012 - 2020 2012 - 2021 Tesla 0.22 0.77 Tesla 5.71 4.88 4.76 123 1 Includes all major manufacturing sites: Fremont Factory and supporting facilities, Gigafactory Nevada, Gigafactory New York, Tesla Grand Rapids and Gigafactory Shanghai. 2 Includes major manufacturing sites dedicated to vehicle production: Fremont Factory and supporting facilities, Gigafactory Nevada Vehicle Operations, Tesla Grand Rapids and Gigafactory Shanghai. *PwC performed an attest review engagement on this metric. See their report on page 138.
 Tesla 2021 Impact Report Page 122 Page 124