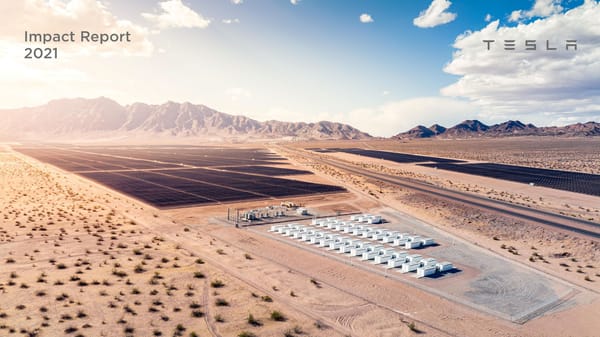
Tesla 2021 Impact Report
1
Foreword on Impact What ESG measures today: Investment Risk What ESG needs to become: Company Impact Current ESGevaluation Current environmental, social and governance (ESG) We need to create a system that measures and scrutinizes methodologies are reporting does not measure the scope of positive impact actual positive impact on our planet, so unsuspecting fundamentally flawed. To on the world. Instead, it focuses on measuring the dollar individual investors can choose to support companies that achieve acutely-needed value of risk / return. can make and prioritize positive change. change, ESG needs to Individual investors – who entrust their money to ESG On the product front, companies should be required to use evolve to measure real- funds of large investment institutions – are perhaps real-world data wherever remotely feasible and make it world Impact. unaware that their money can be used to buy shares of clear when estimates are provided instead of real-world companies that make climate change worse, not better. figures. An example of this is vehicle “use-phase” emissions, accounting for the vast majority of lifecycle An obvious example of this is measuring the impact of the emissions. Automakers' estimates on lifetime vehicle automotive industry. One might think that the more electric mileage and lifetime fuel consumption vary dramatically vehicles an automaker sells, as a percentage of total and almost never reflect real-world data. Automakers often volumes, the better its ESG score. However, this is not the have access to this data, but they don’t disclose it. case. As long as a company continues to slightly decrease emissions of its manufacturing operations while churning When it comes to a company’s employees, it is essential out gas-guzzlers, its ESG ratings are likely to go up. that they’re treated well, with a system in place to prevent discrimination of any kind, that they have a safe Vehicle use-phase emissions, which represent 80-90% of workplace and that they are rewarded appropriately, with total automotive emissions (included in Scope 3 of ESG significant upside if their employer does well. reporting), tend to be misreported due to the use of unrealistic assumptions or not reported at all. Many ESG ratings evaluate: “Does this ESG issue impact the profitability of the company?” We need a system that It’s easy to see why some oil & gas companies rank higher evaluates: “Does the growth of this company have a than Tesla on “Environmental Impact.” positive impact on the world?” “The most striking feature of the [ESG rating] system is This evolution of ESG needs to be championed by how rarely a company’s record on climate change seems to institutional investors, rating agencies, public companies get in the way of its climb up the ESG ladder—or even to and the general public. As the world needs to strive for a factor at all.” substantial positive impact, we won’t be referring to ESG in this report. Instead, we’ll talk about Impact. ESG Mirage: Bloomberg Businessweek 2
In 2021, the global fleet of Tesla vehicles, energy storage and solar panels enabled our customers to avoid emitting 8.4 million metric tons of CO2e The 6.8 million metric tons of vehicle CO e savings estimate is based on the net CO e savings during the use-phase of a Tesla vehicle compared to an ICE vehicle with a real-world fuel economy of 2 2 ~24 mpg (of which 0.9 million metric tons was avoided through annual renewables matching for the global Supercharger network and home charging in California). The 1.6 million metric tons of solar + storage CO2e savings estimate is based on CO2e avoided through generation of zero-emission electricity from Tesla solar panels, including energy stored and later dispatched from our energy storage products. Geographic distribution of our deliveries (both vehicle and solar), grid mix at the country, state and province level and upstream emissions are reflected in these figures. 3
The Future is Electric Lifetime fuel consumption and use-phase GHG emissions 30,000 litres (~8,000 U.S. Gallons) of fuel burned per car 70 tons of CO e released into the atmosphere 2 Burned fossil fuel is extremely difficult to decarbonize as carbon capture is not economically viable today 70 MWh of electricity charged per car 30 tons of CO2 released, assuming currentglobal grid mix Production and lifetime use of EVs is possible to decarbonize using well-established technologies Battery pack is recycled at the end-of-life and used to build a brand-new battery pack, over and over again. 4
More Energy Generation Tesla solar panels have generated more electricity than has been ThanConsumption consumed by our vehicles and factories between 2012 and 2021 Tesla Cumulative Net Energy Impact: 2012-2021 (TWh) 5
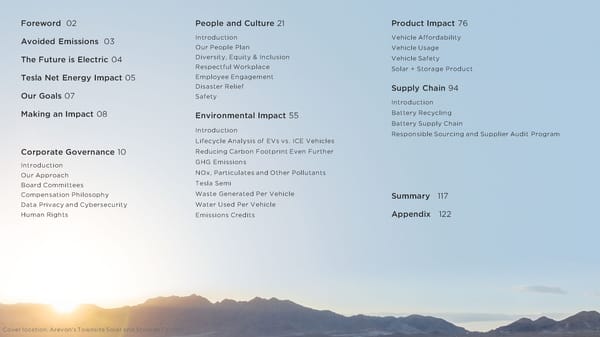
Foreword 02 People and Culture 21 Product Impact 76 Avoided Emissions 03 Introduction Vehicle Affordability Our People Plan Vehicle Usage The Future is Electric 04 Diversity, Equity & Inclusion Vehicle Safety Respectful Workplace Solar + Storage Product Tesla Net Energy Impact 05 Employee Engagement Disaster Relief Supply Chain 94 Our Goals 07 Safety Introduction Making an Impact 08 Environmental Impact 55 Battery Recycling Battery Supply Chain Introduction Responsible Sourcing and Supplier Audit Program Lifecycle Analysis of EVs vs. ICE Vehicles Corporate Governance 10 Reducing Carbon Footprint Even Further Introduction GHG Emissions Our Approach NOx, Particulates and Other Pollutants Board Committees Tesla Semi Compensation Philosophy Waste Generated Per Vehicle Summary 117 Data Privacy and Cybersecurity Water Used Per Vehicle Human Rights Emissions Credits Appendix 122 Cover location: Arevon'sTownsite Solar and Storage Facility
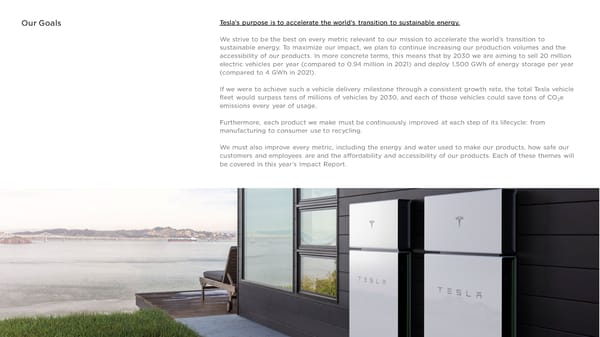
Our Goals Tesla’s purpose is to accelerate the world’s transition to sustainable energy. We strive to be the best on every metric relevant to our mission to accelerate the world’s transition to sustainable energy. To maximize our impact, we plan to continue increasing our production volumes and the accessibility of our products. In more concrete terms, this means that by 2030 we are aiming to sell 20 million electric vehicles per year (compared to 0.94 million in 2021) and deploy 1,500 GWh of energy storage per year (compared to 4 GWh in 2021). If we were to achieve such a vehicle delivery milestone through a consistent growth rate, the total Tesla vehicle fleet would surpass tens of millions of vehicles by 2030, and each of those vehicles could save tons of CO2e emissions every year of usage. Furthermore, each product we make must be continuously improved at each step of its lifecycle: from manufacturing to consumer use to recycling. We must also improve every metric, including the energy and water used to make our products, how safe our customers and employees are and the affordability and accessibility of our products. Each of these themes will be covered in this year’s Impact Report. 7

Making an Impact Sustainability drives us. And not just our products — it drives our values and mission as a company. It's at the Mission and the Tesla Ecosystem core of everything we do and is what motivates us in our work. It also matters greatly to our customers, employees and shareholders. Our products and services are focused on transportation, energy production and storage — each of which have traditionally been some of the biggest polluters both in the U.S. and globally. To achieve a zero-emissions future, we continue to implement programs and initiatives at our global manufacturing facilities and in our local communities. Global U.S. Greenhouse Gas (GHG) Emissions Greenhouse Gas (GHG) Emissions by Economic Sector by Economic Sector Other Agriculture, Forestry & Other 12% Other Land Use 9% 3% Electricity & Building Electricity & Heat 6% Heat Production* Production* 35% 31% Building 11% Agriculture, Forestry & Other Land Use 15% Industry 12% Industry Transportation* 19% 17% Transportation* 30% *Tesla-related sectors. Source: World Resources Institute 8
Making an Impact Addressing climate change through an entire ecosystem Mission and the Tesla Ecosystem Climate change is reaching alarming levels globally due in large part to emissions from burning fossil fuels for transportation and electricity generation. The world cannot reduce GHG emissions without addressing both energy generation and consumption. And the world cannot address its energy habits without first directly reducing emissions in the transportation and energy sectors. We are designing and manufacturing a complete energy and transportation ecosystem. We both develop the technology behind this ecosystem and focus on the affordability of the products that comprise it. We seek to achieve this through our R&D and software development efforts as well as through our continuous drive to develop advanced manufacturing capabilities. 9
Corporate Governance 10
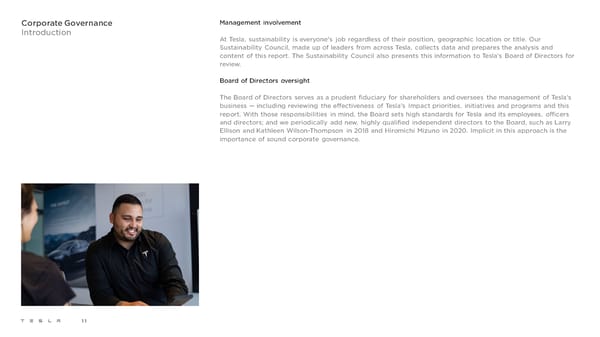
Corporate Governance Management involvement Introduction At Tesla, sustainability is everyone's job regardless of their position, geographic location or title. Our Sustainability Council, made up of leaders from across Tesla, collects data and prepares the analysis and content of this report. The Sustainability Council also presents this information to Tesla’s Board of Directors for review. Board of Directors oversight The Board of Directors serves as a prudent fiduciary for shareholders and oversees the management of Tesla’s business — including reviewing the effectiveness of Tesla’s Impact priorities, initiatives and programs and this report. With those responsibilities in mind, the Board sets high standards for Tesla and its employees, officers and directors; and we periodically add new, highly qualified independent directors to the Board, such as Larry Ellison and Kathleen Wilson-Thompson in 2018 and Hiromichi Mizuno in 2020. Implicit in this approach is the importance of sound corporate governance. 11
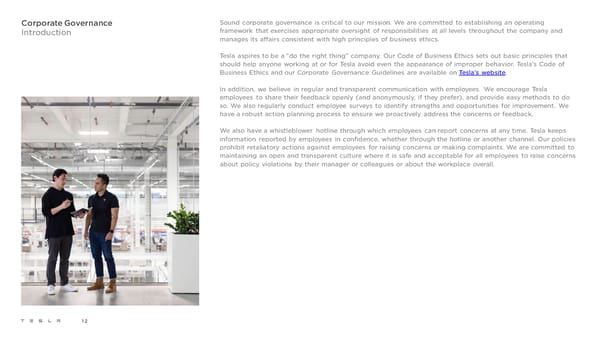
Corporate Governance Sound corporate governance is critical to our mission. We are committed to establishing an operating Introduction framework that exercises appropriate oversight of responsibilities at all levels throughout the company and manages its affairs consistent with high principles of business ethics. Tesla aspires to be a “do the right thing” company. Our Code of Business Ethics sets out basic principles that should help anyone working at or for Tesla avoid even the appearance of improper behavior. Tesla’s Code of . Business Ethics and our Corporate Governance Guidelines are available on Tesla’s website In addition, we believe in regular and transparent communication with employees. We encourage Tesla employees to share their feedback openly (and anonymously, if they prefer), and provide easy methods to do so. We also regularly conduct employee surveys to identify strengths and opportunities for improvement. We have a robust action planning process to ensure we proactively address the concerns or feedback. We also have a whistleblower hotline through which employees can report concerns at any time. Tesla keeps information reported by employees in confidence, whether through the hotline or another channel. Our policies prohibit retaliatory actions against employees for raising concerns or making complaints. We are committed to maintaining an open and transparent culture where it is safe and acceptable for all employees to raise concerns about policy violations by their manager or colleagues or about the workplace overall. 12
Corporate Governance Our unique business requires a unique approach to corporate governance. And our mission requires a long-term Our Approach focus that we believe will ultimately maximize value to our employees and our stockholders. Our corporate governance structure has facilitated several key decisions which might have appeared counter-intuitive to some, but which have set up the Tesla to achieve long-term success. Some examples include our decisions to: • Manufacture all-electric vehicles (EVs) from the ground up rather than being a mere supplier of EV components • Establish an international network of our own stores, service centers and Supercharger stations despite regulatory hurdles and the significant capital outlay required to do so • Build Gigafactory 1, the largest lithium-ion battery factory in the world, so that we can scale most effectively • Expand into energy generation and storage through the acquisition of SolarCity Corporation in 2016 to create a vertically integrated sustainable energy company and empower individual consumers to be their own utility • Deploy FSD city streets beta software to our fleet to develop complete Full Self-Driving capability in the future • Compensate our CEO only if other shareholders realize tremendous value These and other similar decisions were made due to our corporate governance structure and, ultimately, decisions like these are what differentiate Tesla from other companies and are a significant reason why the annualized stockholder return since our 2010 IPO until December 31, 2021 equaled 65%. At the same time, the Board continuously evaluates our corporate governance structure, practices and policies, and weighs stakeholder feedback including proposals we have historically received at our annual meetings. For example, at our 2021 annual meeting of stockholders, the Board proposed and recommended that stockholders adopt an amendment to our certificate of incorporation to reduce the term of our directors to two years. However, our stockholders did not approve that proposal. The Board is directly and regularly engaged with senior management and the Sustainability Council and participates in robust shareholder outreach and feedback. In addition, our directors have significant experience as either top-level executives at public companies, as successful investors or as entrepreneurs who founded successful organizations. 13
Corporate Governance Committees of the Board Board Committees (as of March 1, 2022) The Board has four standing committees — the Audit Committee, the Compensation Committee, the Nominating and Corporate Governance Committee and the Disclosure Controls Committee — which are each further described in the following pages. Each member of these committees qualifies as an independent s e l e o director under the listing standards of NASDAQ. In addition, as part of our governance review and succession t n r t o e t e &e e i i n g c t e o e n e planning, the Board (led by the Nominating and Corporate Governance Committee) evaluates our leadership m a t t n t s t t i a t Year m n C t n structure to ensure that it remains the optimal structure for Tesla, reviews the composition, size and Name Function o e e a joined r n er C p u i s v performance of the Board and its committees, evaluates individual directors and identifies and evaluates t ommi ommim ommi i m o o o d o C l C G C u C c N candidates for election or re-election to the Board. Committee charters were updated in 2021 to reflect the s A i D growing risks and opportunities around ESG. Robyn Denholm Independent 2014 X X X X Board chair Board role in risk oversight Elon Musk Director and 2004 CEO Ira Ehrenpreis Independent 2007 X X The Board is responsible for overseeing the major risks facing Tesla, while management is responsible for director assessing and mitigating Tesla’s risks on a day-to-day basis. In addition, the Board has delegated oversight of Larry Ellison Independent 2018 certain categories of risk to its independent committees, which then report to the Board, as appropriate, on director matters that involve the specific areas of risk that each committee oversees. Hiromichi Independent 2020 X Mizuno director James Murdoch Independent 2017 X X X director Kimbal Musk Director 2004 Kathleen Independent Wilson- director 2018 X X X Thompson 14
Corporate Governance Audit Committee Board Committees (as of March 1, 2022) The Audit Committee is responsible for, among other things, assisting the Board in providing oversight of Tesla’s accounting and financial reporting processes and the audit of its financial statements, including oversight over the integrity of such statements, the Company’s compliance with legal and regulatory s e l e o requirements, the independent auditor’s qualifications, independence and performance, the organization and t n r t o e t e &e e i i n g c t e o e n e performance of the Company’s internal audit function, as well as the Company’s internal accounting and m a t t n t s t t i a t Year m n C t n financial controls, treasury and finance matters, risk management, including data privacy and cybersecurity. The Name Function o e e a joined r n er C p u i s v Audit Committee also reviews and discusses the accounting assessment of this report and other ESG t ommi ommim ommi i m o o o d o C l C G C u C c N disclosures. s A i D Robyn Denholm Independent 2014 X X X X Compensation Committee Board chair Elon Musk Director and 2004 CEO The Compensation Committee is responsible for, among other things, discharging the Board’s responsibilities in Ira Ehrenpreis Independent 2007 X X administering and overseeing Tesla’s compensation policies, plans and benefit programs, the compensation of director Tesla’s executive officers and members of the Board, the administration of the Company’s employee benefit Larry Ellison Independent 2018 plans and the review of human capital management practices related to Tesla’s talent generally (including how director Tesla recruits, develops and retains diverse talent). Hiromichi Independent 2020 X Mizuno director James Murdoch Independent 2017 X X X Disclosure Controls Committee director Kimbal Musk Director 2004 The Disclosure Controls Committee, among other things, implements, reviews and monitors Tesla’s compliance Kathleen with applicable legal requirements governing the Company’s and its executive officers’ public disclosures and Wilson- Independent 2018 X X X public statements relating to the Company. Thompson director Nominating and Corporate Governance Committee The Nominating and Corporate Governance Committee is responsible for, among other things, reviewing and making recommendations to the Board on matters concerning corporate governance, Board composition, the identification, evaluation and nomination of director candidates and composition of Board committees and conflicts of interest. In addition, this Committee oversees Tesla’s corporate governance practices and reviews annually the principles of corporate governance approved by the Board, including the Company’s Code of Business Ethics and Corporate Governance Guidelines, to ensure that they remain relevant and are being complied with and monitored by management, recommending changes to the Board as necessary. 15
Corporate Governance Our compensation philosophy reflects our long-term mission and our startup origins. We emphasize structuring Compensation Philosophy compensation to reward our named executive officers based on performance, and equity awards weigh heavily in our named executive officers’ total compensation, including awards that vest upon the achievement of clear and measurable milestones. Since these awards increase in value as our stock price increases (and in the case of stock option awards, have no value unless our stock price increases following their grant), our named executive officers’ incentives are closely aligned with the long-term interests of our stockholders. Tesla has no cash bonus program for any of our named executive officers and generally does not provide any perquisites or tax reimbursements to our named executive officers that are not available to other employees. No named executive officer has any severance or change of control arrangement, except as reflected in Elon Musk’s performance-based 2018 CEO Performance Award. A change in control modifies the vesting requirements of the 2018 CEO Performance Award such that vesting of the Award’s tranches would be measured based on Tesla’s market capitalization at the time of the change of the control, without regard to the operational milestones of the Award. Elon Musk, our Chief Executive Officer, historically earned a base salary that reflected the applicable minimum wage requirements under California law, and he was subject to income taxes based on such base salary. However, he has never accepted his salary. Commencing in May 2019 at Mr. Musk’s request, we eliminated altogether the earning and accrual of this base salary. Consequently, 100% of Mr. Musk’s compensation is at-risk. Similarly, the compensation program for Tesla’s non-employee directors is designed to be consistent with our compensation philosophy for our employees, with an emphasis on equity-based compensation over cash in order to align the value of their compensation with the market value of our stock, and consequently, with the long-term interests of our stockholders. Moreover, while we offer to our general employee population restricted stock units that will retain some value even if the market value of our stock decreases, the equity-based compensation to our directors has been exclusively in the form of stock options, which have zero initial value and accumulate value, if at all, only to the extent that our stock price increases following their grant, through the applicable vesting dates and until such stock options are ultimately exercised and the underlying shares are sold. The remaining portion of our directors’ compensation has been comprised of cash retainer payments that are relatively modest compared to peer companies and that may be waived at the election of each director. Further, in June 2021, the Board adopted a resolution that all existing directors forego any automatic grants of annual stock option awards under our director compensation policy until July 2022 unless the Board determines otherwise. 16
Corporate Governance Tesla builds products with privacy and security at their core Data Privacy and Cybersecurity We believe that responsible data management and transparency is a prerequisite for continuous innovation. We live up to this commitment by providing information and controls in our products that let you choose how your personal data is collected and used. Managing data privacy is a shared task through all levels of our organization Data privacy is a shared responsibility in which every employee and our Board is expected to participate. Tesla has a large and diverse team of privacy and security professionals from all over the world and across legal, engineering and product organizations, who are dedicated to protecting customer data. Additionally, the Audit Committee of the Tesla Board of Directors is regularly briefed on incidents, emerging trends, controls and corrective actions taken by Tesla to ensure we are living up to our obligations and Privacy Principles. Tesla’s Privacy Principles Tesla is guided not only legally by its obligations under global privacy laws and regulations, but also by customer expectations and our Privacy Principles. We do the right thing with data. We maintain trust by handling data as customers expect, keeping it accurate and complete and properly destroying it when it is no longer needed. • We build privacy into our products from start to finish. Ensuring privacy is an important component when building world-class products and services, from inception to rollout and beyond. • We give customers choices about their data. We put individuals in control by giving them clear and transparent ways to access, review, manage and delete their data with ease. • We maintain trust through transparency. We are clear about the personal data we collect and how we're using or sharing it – ensuring that choosing a connected vehicle does not come at the sacrifice of customer privacy. • We safeguard personal data. We implement rigorous controls and standards designed to protect the security, confidentiality and integrity of Tesla’s data environment. 17
Corporate Governance Privacy from day one Data Privacy and Cybersecurity Tesla’s Privacy Principles and commitments are illustrated throughout all our products. For Tesla vehicles, customer personal data is protected from the moment they take delivery, ensuring that by default the vehicle data generated when driving is not associated with the customer's account or vehicle identification number. Tesla also puts customers in the driver’s seat when it comes to data sharing by providing a dedicated in-vehicle menu to adjust preferences at any time. Additionally, from Powerwall to Solar Roof, energy products are designed to protect customer privacy. Tesla aims to collect a minimum amount of personal data necessary in providing the most engaging in-app energy experience. In furtherance of transparency, Tesla has developed a seamless way for customers to download and access their energy data at any time right from the Tesla app. Engaging the security community We are also focused on ensuring that our vehicles are the most secure on the road. To do that, our team of world-class engineers works day in and day out to ensure that our systems are always as secure as possible. And while some of the best security engineers work at Tesla, we believe that in order to design and build inherently secure systems, we cannot work alone. We work closely with the security research community to benefit from their collective expertise and diversity of thought. Continuous product improvement Tesla pioneered the concept of vehicles that improve and become more capable over time by ensuring that every Tesla vehicle made since 2012 can accept over-the-air (OTA) software updates. These updates have introduced new features and functionality that have made our vehicles smarter, safer and more enjoyable to drive. We have also used the OTA system to ensure that our vehicles are not only as secure as possible when they are delivered, but that they continue to stay as secure as possible throughout their lifetime. 18
Corporate Governance Human rights are core to our mission of a sustainable future Human Rights The ethical treatment of all people and regard for human rights is core to our mission of a sustainable future. We believe all businesses within our supply chain have a responsibility to share our respect for human rights. Our human rights policy is the formalization of our commitment to uphold and respect these rights and the values they represent. We endorse and base our definition of human rights on the United Nation's Universal Declaration for Human Rights (UDHR). The UDHR focuses on dignity, respect and equality, without discrimination, for all people. We are committed to upholding these rights and values throughout our value chain — including with respect to our employees, customers, shareholders, suppliers and the communities in which we operate. We require that our suppliers will also support and promote these values in their own operations and in those of their own suppliers. Addressing human rights risks is an ongoing effort, involving engagement with our value chain for potential impacts, incorporating input from external stakeholders and reviewing and updating our own policies where necessary. With this understanding, Tesla is committed to addressing any potential human rights issues both within our own operations and those of our value chain. You can see our full Human Rights policy here. 19
Corporate Governance We have a zero-tolerance policy when it comes to child or forced labor and human trafficking by our suppliers Human Rights At Tesla, we are committed to ensuring that the way we conduct our business and dealings with our suppliers reflects our values and our belief that everyone should be treated with dignity and respect. Tesla is committed to ensuring that our suppliers do not use slave or child labor or engage in human trafficking. Modern slavery, child labor and human trafficking are crimes under the laws of countries throughout the world, but unfortunately continue to exist all over the globe. Our commitment on this front is summarized in our Supplier Code of Conduct as well as in our Human Rights Policy and Responsible Materials Policy, and we continue to work to ensure that our suppliers uphold the principles in these statements. We look to the Organization for Economic Co-operation and Development (OECD) Due Diligence Guidelines to inform our process and use feedback from our internal and external stakeholders to find ways to continually improve it. Through our commitment to enforce our Supplier Code of Conduct, Human Rights Policy and Responsible Materials Policy, continuous training and the supplier audit and due diligence efforts, Tesla believes that there is low risk of, and have found no evidence to date of Tesla causing, contributing to or being linked to modern slavery, child labor or human trafficking in our supply chain. For more information on our commitment to anti-slavery practices and an affirmation of the values we hold and adopt across Tesla’s business operations and supply chain, including how we assess risks and effectiveness of our actions, please see our California Transparency in Supply Chain Acts Statement and our U.K. Modern Slavery . Act Transparency Statement 20
People and Culture 21
People and Culture What do we see as impact? Introduction Our employees have gotten us to where we are today. To continue innovating and changing the world for the better, we must ensure we have a talented and engaged workforce with ample opportunity to contribute to our mission and grow professionally. Meaningful work: Working for Tesla is not just any job. The products we build are necessary for transitioning to a sustainable future. Respectful, safe, inclusive and equitable workplace: Tesla is a majority-minority company. We strive to be a workplace where people love to come to work every day. While challenges will arise, Tesla has a zero-tolerance policy for harassment of any kind, and we will continue to address them head on as we keep growing. We hire a lot: We created nearly 100,000 direct new jobs in a decade. While many manufacturers are trimming their operations, we are growing as quickly as is feasible. Pay well: We want to make sure that we pay competitive wages, regardless of the region. Significant upside potential: Every single employee of our company can receive their grants in stocks or options. If our company does well, every employee can benefit materially from Tesla’s success. Outstanding benefits: We want our benefits to be an outlier in the manufacturing industry. Among other benefits, we provide medical, dental and vision plans with no paycheck deductions, 401k matching, life insurance, parental leave and family building benefits. Build the future: Who wouldn’t want to work for a company with a mission of building a future we all want? Tesla’s mission is not only about making a product that people love, but also about making a real, sustained impact on transitioning the world to sustainable energy. In 2021, we received 3,000,000 job applications from those wanting to be a part of this mission. 22
People and Culture Nearly 100,000 direct jobs in a decade — and we continue to hire extensively Our Plan #1: Attracting Our employee count has grown ~70 fold over the past decade and, in just over ten years, Tesla has created nearly 100,000 direct jobs. While many companies in the automotive industry have been trimming the number of employees and launching early retirement programs, we plan to grow our employee base for years to come. As we are aiming to produce over 20x more cars by 2030 than we did in 2021, we will need to continue to build new factories and hire for those new locations. Gigafactories in Texas and Berlin will recruit extensively starting this year, which means that our job creation will continue to expand for quite some time. Tesla Global Employee Count 100,000 80,000 60,000 40,000 20,000 0 2010 2011 2012 2013 2014 2015 2016 2017 2018 2019 2020 2021 23
People and Culture Number of applicants continues to break records Our Plan #1: Attracting By attracting, developing and retaining excellent talent, we've developed a pipeline of diverse and exceptional candidates while fostering an inclusive culture that supports them once they become employees. Whether it is through our direct hiring opportunities, internships or workforce development programs, interest in joining Tesla’s mission is at an all-time high. We had more than 3,000,000 unique applicants globally in 2021 alone. We expanded access to hiring opportunities for underrepresented communities by centering diversity, equity and inclusion (DEI) in our hiring process. We did so by increasing gender-neutral language in our job descriptions, broadening our sourcing efforts, revamping interviewing guides, building community partnerships, educating on unconscious bias and facilitating training for recruiters, hiring managers and interview panelists. Global Number Of Applicants Per Year 3,500,000 3,000,000 2,500,000 2,000,000 1,500,000 1,000,000 500,000 0 2019 2020 2021 24
People and Culture Engineers want to work for Tesla Our Plan #1: Attracting According to Universum 2021 rankings, engineering students want to work for Tesla and SpaceX more than any other organization. Many successful companies with great engineering can become bureaucratic over time. We don’t want to go that route. At Tesla, great engineering ideas worth implementing can come from interns, analysts or executives. We strive to minimize red tape so our engineers can be creative and solve engineering problems that have never been solved. Ultimately, the long-term success of any company comes down to the pace of innovation. It doesn’t matter how far ahead or far behind our technology is, what matters is the pace at which we’re evolving, implementing new ideas and engineering solutions. In order to maintain our pace of innovation we must continue to attract the best and the brightest to join our mission. Top Choice For Graduate Engineers (Universum 2021 Survey) 1 SpaceX 17 General Motors 2 Tesla 20 Ford Motor Company 3 NASA 21 Toyota 4 Lockheed Martin 22 Intel 5 Boeing 26 BMW Group 6 Google 29 IBM 7 Apple 32 Blue Origin 8 Microsoft 33 Honda 9 Northrop Grumman 34 Nvidia 10 Amazon 40 AMD 25
People and Culture No university degree required Our Plan #1: Attracting We are continuing to provide the local community access to thousands of job openings across the U.S. in manufacturing, vehicle service and solar roof installation, offering full benefits and training from day one. We have long stated publicly that candidates do not need to have a college degree to work at Tesla. This represents an enormous opportunity for high school graduates from underserved communities to join us in our mission and grow their careers. Manufacturing Development Program This is a two-year program where recent high school graduates in the U.S. start a career at Tesla as a production associate while continuing their education in automation and robotics at a local community college. Since its launch in 2017, we've hired 168 graduates into this program, with active programs at Gigafactory Nevada, Gigafactory New York and our Fremont Factory. We also launched our first Manufacturing Development Program class with Del Valle High School to support Gigafactory Texas in fall 2021. Tool & Die Apprenticeship In partnership with local community colleges, Tesla offers a federal and state certified Tool & Die Apprenticeship program in the U.S. at the Fremont Factory, Gigafactory Nevada and Tesla Grand Rapids. These apprenticeships blend on-the-job training by qualified mentors with classroom learning, providing a holistic approach to learning a trade in high demand. Apprentices learn welding, machining, blueprint reading and other critical skills. Similar programs run in Europe, including at the Gigafactory Berlin where we collaborate with local vocational schools and train students via facilitated workshops, self-led modules and on-the-job exercises for a variety of roles. 26
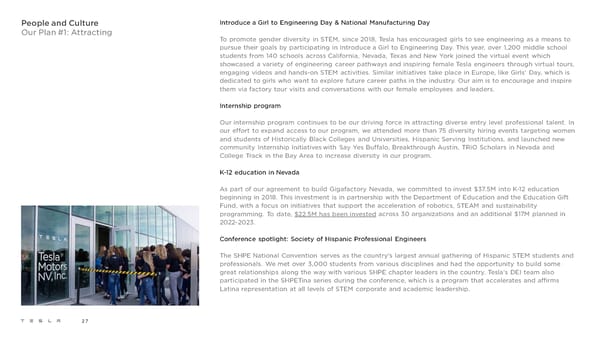
People and Culture Introduce a Girl to Engineering Day & National Manufacturing Day Our Plan #1: Attracting To promote gender diversity in STEM, since 2018, Tesla has encouraged girls to see engineering as a means to pursue their goals by participating in Introduce a Girl to Engineering Day. This year, over 1,200 middle school students from 140 schools across California, Nevada, Texas and New York joined the virtual event which showcased a variety of engineering career pathways and inspiring female Tesla engineers through virtual tours, engaging videos and hands-on STEM activities. Similar initiatives take place in Europe, like Girls’ Day, which is dedicated to girls who want to explore future career paths in the industry. Our aim is to encourage and inspire them via factory tour visits and conversations with our female employees and leaders. Internship program Our internship program continues to be our driving force in attracting diverse entry level professional talent. In our effort to expand access to our program, we attended more than 75 diversity hiring events targeting women and students of Historically Black Colleges and Universities, Hispanic Serving Institutions, and launched new community Internship Initiativeswith Say Yes Buffalo, Breakthrough Austin, TRiO Scholars in Nevada and College Track in the Bay Area to increase diversity in our program. K-12 education in Nevada As part of our agreement to build Gigafactory Nevada, we committed to invest $37.5M into K-12 education beginning in 2018. This investment is in partnership with the Department of Education and the Education Gift Fund, with a focus on initiatives that support the acceleration of robotics, STEAM and sustainability programming. To date, $22.5M has been invested across 30 organizations and an additional $17M planned in 2022-2023. Conference spotlight: Society of Hispanic Professional Engineers The SHPE National Convention serves as the country’s largest annual gathering of Hispanic STEM students and professionals. We met over 3,000 students from various disciplines and had the opportunity to build some great relationships along the way with various SHPE chapter leaders in the country. Tesla’s DEI team also participated in the SHPETina series during the conference, which is a program that accelerates and affirms Latina representation at all levels of STEM corporate and academic leadership. 27

People and Culture Exceeding comparable manufacturing role compensation Our Plan #2: Compensating Tesla provides a highly competitive wage that meets or exceeds the wages of comparable manufacturing roles, even before equity and benefits are factored in. In 2021, Tesla’s average national wage for manufacturing jobs in the U.S. was $21.60/hour plus benefits (which, among others listed on the next page, includes an option for $0 cost paycheck deductions) and equity, which is a 2.2% increase compared to 2020. According to the Bureau of Labor Statistics, the mean hourly wage for Production Associates / Assemblers is $18.17 and the median is $17.59. Tesla continuously reviews salary and wages against benchmarks and adjusts to ensure wages are competitive. Evaluations for promotions also take place annually. The impact of stock-based compensation can be material for employees Our employees have benefited enormously from value appreciation of our stock seen through the years. While share prices will remain volatile and past performance is not indicative of future results, stock-based compensation brings shared ownership to the workforce, and our employees are encouraged to make a positive change for the benefit of all. Culturally, shared ownership of the company is one of the most essential attributes of working at Tesla. For example, assume that an employee received a grant of 320 Tesla shares in 2018 that vested 20 shares quarterly over 16 quarters (4 years). Based on the stock price at the time of the grant, the quarterly vest of 20 Tesla shares would equate to $1,331-worth of sellable shares at the end of 2018. However, the same vest two years later would equate to $14,113-worth of sellable shares per quarter based on the increase in the price per share of Tesla stock over that period. Employees are also eligible to buy additional stock at a discount through the Employee Stock Purchase Program. Value Creation at TSLA, Contributed to by 10,000s of Employees, Had Material Compensation Impact $1,400 $1,200 e$1,000 c ri$800 P re$600 a h $400 S $200 $0 28 2017 2018 2019 2020 2021 2022
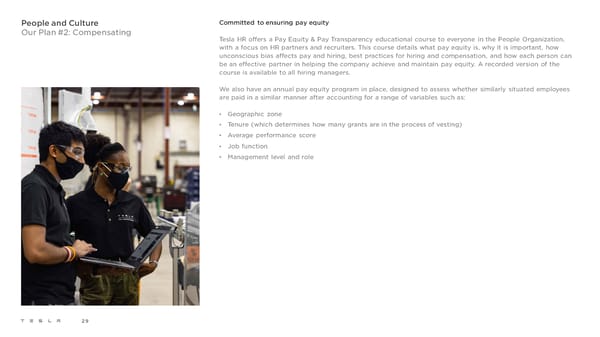
People and Culture Committed to ensuring pay equity Our Plan #2: Compensating Tesla HR offers a Pay Equity & Pay Transparency educational course to everyone in the People Organization, with a focus on HR partners and recruiters. This course details what pay equity is, why it is important, how unconscious bias affects pay and hiring, best practices for hiring and compensation, and how each person can be an effective partner in helping the company achieve and maintain pay equity. A recorded version of the course is available to all hiring managers. We also have an annual pay equity program in place, designed to assess whether similarly situated employees are paid in a similar manner after accounting for a range of variables such as: • Geographic zone • Tenure (which determines how many grants are in the process of vesting) • Average performance score • Job function • Management level and role 29
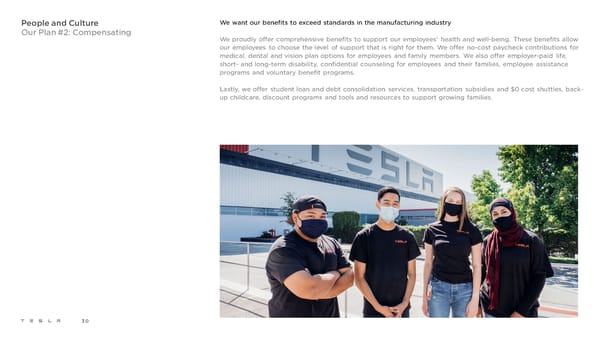
People and Culture We want our benefits to exceed standards in the manufacturing industry Our Plan #2: Compensating We proudly offer comprehensive benefits to support our employees’ health and well-being. These benefits allow our employees to choose the level of support that is right for them. We offer no-cost paycheck contributions for medical, dental and vision plan options for employees and family members. We also offer employer-paid life, short- and long-term disability, confidential counseling for employees and their families, employee assistance programs and voluntary benefit programs. Lastly, we offer student loan and debt consolidation services, transportation subsidies and $0 cost shuttles, back- up childcare, discount programs and tools and resources to support growing families. 30
People and Culture Since 2007, we have provided: Our Plan #2: Compensating • A $0 paycheck contribution medical plan • A Confidential Counseling/Employee Assistance Program • A $0 paycheck contribution dental plan and vision plan • A $0 cost shuttle service to and from underserved transportation hubs in California and Nevada • Employer-paid life insurance • Employer-paid short-term and long-term disability Since 2016: • SafetyNet, a benefit that provides limited financial assistance for employees experiencing temporary hardship such as the sudden loss of housing, emergencies/natural disasters or expenses related to the loss of an immediate family member Since 2018: • 5 days of back-up child/elder care for employees • Infertility benefits, including assisted reproductive technologies • Transgender benefits aligned with the clinical protocol set forth by the World Professional Association for Transgender Health Since 2019: • Rethink, a benefit that provides resources for families with children who have learning, social or behavioral challenges Since 2021: • An expanded Safety Net program and health insurance offering that includes travel and lodging support for those who may need to seek healthcare services that are unavailable in their home state Since 2022: • A benefits concierge service for LGBTQ+ employees • 401k contribution matching 31
People and Culture Parental and family leave benefits Our Plan #2: Compensating Whether it's family planning or support for employees spending time with their family after the birth or adoption of a child, Tesla provides benefit and leave options to all active full-time employees in the U.S. • Fertility Services including IVF, IUI and Egg/Embryo/Sperm Preservations up to $40,000 offered through Kindbody • Adoption, up to $25,000 offered through Kindbody • Third-Party reproduction services (donor & surrogacy), up to $25,000 offered through Kindbody • 16 weeks of Paid Family Leave • Up to one week of paid time off as a new parent through Tesla Child Bonding. This benefit can be taken following the birth or adoption of a child by an employee, their spouse or domestic partner. • Six weeks of paid time off for new parents that have worked for Tesla for at least one year (12 consecutive months) • Disability benefits • Pay for nine weeks of maternity leave 32
People and Culture Employee satisfaction is improving Our Plan #3: Retaining When going through a challenging period or when the viability of a business is not yet clear, it’s likely to have an impact on employee satisfaction. Our early years of Model 3 production and global expansion were some of the most difficult in our history and our employee satisfaction ratings (Glassdoor) reflected that. Our company is in a different phase now. Model 3 has become the best-selling premium sedan globally and profitability (operating margin) rose to the highest in the industry. This has fueled our ability to expand dramatically and provide career opportunities for many strong performers. Compensation, linked to the performance of the company, also improved substantially in recent years. There’s still a lot of work to be done, predominantly when it comes to work-life balance. Our goals have always been, and still are, bold. Expectations are understandably high as a result. We recently introduced unlimited vacation for salaried employees and added more family benefits. Both Glassdoor rankings as well as our internal data show that our employees are becoming happier as a result of our growing success as well as our expanded employee benefit programs. Employee Satisfaction Over Time — Glassdoor Ratings 4.0 3.8 3.6 3.4 3.2 3.0 2018 2019 2020 2021 33
People and Culture Majority of promotions are internal Our Plan #3: Retaining We believe our employees should have opportunities without limitations. Employees that start in junior roles can ultimately become company leaders – and many of our long-term employees have done exactly that. Upward mobility in our fast environment is a significant contributor to retaining top talent. We want to make sure that our employees continue to learn and evolve. As nearly 70% of our leadership is promoted from within Tesla, our employees are surrounded by examples of successful progression. Our global headcount increased by over 40% in 2021. At that pace of growth, some level of external hiring will be necessary. If possible, we do our best to fill each leadership role with an internal candidate. Breakdown Of New Managers, Executives and Directors in 2021 Hired externally 31% Promoted from within 69% 34
People and Culture Integrating Diversity, Equity and Inclusion (DEI) principles and practices into the DNA of our company Our Plan #4: DE&I Throughout In 2020, we instituted quarterly diversity data reviews across different divisions. These ensure that we identify trends across functions instead of simply looking at our workforce at the company-wide level. Executives review organizational demographics and work with their DEI, HR and Recruiting partners to create an action plan to attract, develop and retain talent. That same year, we also took steps to incorporate DEI principles into talent management. The fundamental pillar in this strategy is consistent and fair performance reviews — a reliable review process leads to more equitable access to internal opportunities. Since 2020, we have routinely delivered performance reviews to over 99% of all employees globally. The program has led to improvements in our internal mobility program and employees' access to career opportunities within Tesla. We expanded our leadership development team with a focus on providing DEI offerings to all our U.S. employees. Now all employees are introduced to our DEI principles on their first day as part of orientation and can continue their DEI learning journey throughout their time at Tesla. From our allyship resources, to DEI Life Hacks on our DEI Knowledge Center, to virtual instructor led courses on unconscious bias, inclusive interviewing and inclusive leadership, our employees have access to information no matter where they are. Our Diversity, Equity and Inclusion principles Our DEI team uses a people-first and data-driven approach to champion diversity, equity and inclusion in our business and in the communities in which we operate. We rely on the following guiding principles: • Provide transparency in our DEI programs, identify areas of improvement, celebrate successes and continually iterate and improve our DEI approach • Integrate accountability measures into our business operations • Focus on sustainable solutions that solve problems at the root cause and reimagine new programs with DEI principles embedded in the design • Share knowledge throughout all levels of the organization to aid in personal and professional learning and development 35
People and Culture Diversity data (EEO-1) for U.S. employees: Tesla is a majority-minority company Diversity, Equity & Inclusion We are proud to be a majority-minority company with a large representation of employees from communities that have long struggled to break through the historic roadblocks to equal opportunity in the U.S. As of December 31, 2020, 34% of our directors and vice presidents were non-white. This is a large percentage, considering that just 0.3% of our employees are director level and above at Tesla. We are working to increase minority representation in professional and management categories through our intentional recruiting efforts with Historically Black Colleges and Universities and Hispanic Serving Institutions, activations at the National Society of Black Engineers, the Society of Hispanic Engineers, AfroTech, as well as community partnerships with organizations like College Track and Black Girls Code. We are also working to ensure that the diversity in our entry-level roles will, over time and because of internal movement, be reflected in our leadership roles. Total r s Male r s Female r s o r o e o r o e a r o e in n e c in n e c in n e c a and n e ls a an d n e a an d n e e t i a t i a t i a i n a v a i n a v e i n a v a ic n a i i t a icn a i i a icn a i i al r la R r la R r la R e L f a s n at e o e L f a s n at e al e L f a s n at e m Job Categories r ic awI nd r ic aw I nd r ic aw I nd e it o A r ia I N or it o Ar ia I N or M it o Ar ia I N or h ic r e Hic s n a ll T h ic r e H ic s n a al h ic r e H ic s n a F W o m e if A a k M a W om e if A a k M t W om e if A a k M al n k v c c r n k v c c n k v c c a i a i e a i a i o a i a i t c A r as or c A r as or c A r as or p la at P e l o v p la at P e l o T p la at P e l o o is B N r m A w O is B N r m A w is B N r m A w T H O A T H O A T H O A T Service Workers 42% 30% 6% 2% 16% 0% 4% 100% 26% 20% 5% 2% 16% 0% 1% 70% 16% 10% 1% 0% 0% 0% 2% 30% Laborers & Helpers 34% 36% 16% 3% 6% 1% 5% 100% 32% 35% 15% 2% 5% 1% 5% 94% 2% 1% 1% 1% 1% 0% 1% 6% Operatives 26% 31% 15% 3% 19% 1% 5% 100% 20% 21% 11% 2% 14% 1% 3% 72% 6% 9% 4% 1% 5% 0% 2% 28% Craft Workers 40% 33% 9% 2% 11% 1% 4% 100% 40% 32% 8% 2% 10% 1% 4% 97% 1% 1% 1% 0% 0% 0% 0% 3% Administrative Support 42% 20% 7% 2% 22% 1% 5% 100% 31% 15% 5% 1% 15% 0% 4% 70% 12% 5% 2% 1% 7% 0% 2% 30% Sales Workers 52% 19% 10% 1% 12% 0% 6% 100% 38% 13% 7% 1% 8% 0% 4% 72% 14% 6% 3% 0% 3% 0% 2% 28% Technicians 46% 23% 7% 2% 17% 1% 5% 100% 42% 21% 6% 2% 15% 1% 4% 91% 4% 2% 1% 0% 2% 0% 0% 9% Professionals 48% 9% 3% 0% 37% 0% 3% 100% 39% 7% 2% 0% 27% 0% 2% 77% 9% 2% 1% 0% 10% 0% 1% 23% First/Mid Officials & Mgrs 63% 12% 5% 1% 15% 0% 4% 100% 50% 10% 4% 1% 10% 0% 3% 78% 13% 2% 1% 0% 5% 0% 1% 22% Exec/Sr. Officials & Mgrs 66% 4% 3% 0% 23% 2% 1% 100% 55% 3% 1% 0% 18% 1% 1% 79% 12% 1% 2% 0% 5% 1% 0% 21% Total 38% 24% 10% 2% 20% 1% 4% 100% 31% 19% 8% 2% 15% 1% 3% 78% 7% 5% 3% 0% 5% 0% 1% 22% 36 Tesla data are representative of calendar year 2020 – the latest available EEO-1 filing as of the publishing of this report.
People and Culture Tesla’s diversity data (EEO-1) vs. U.S. tech companies Diversity, Equity & Inclusion Diversity data requires context. We have compared our diversity data with that of other tech companies. In nearly all categories, Tesla’s representation of people of color exceeds that of peer companies. We are working to increase gender representation throughout the company by supporting women-focused organizations and conferences like Society of Women Engineers, Latinas In Tech, TechUp For Women, Silicon Valley Forum, Women in Technology Festival, Women in Technology International and Women in Manufacturing. We also launched Tesla Recharge Returnship Program – a four-month paid work program that initially targeted women impacted by the pandemic and later expanded to support all mid-career professionals transitioning back into the workforce after a leave of one year or more. The table below shows Tesla employee distribution compared to average employee distribution of U.S. tech companies. Values that are higher than the tech company average distribution are shown with positive values and green shading. Values that are lower than the average are shown with negative values and yellow shading. Total r s Male r s Female r s o r o e o r o e a r o e in n e c in n e c in n e c a an d n e ls a an d n e t a and n e e t i a t i a i a ic i n a v a ic i n a v e a ic i n a v a r n a la i i R t a r n a la i i R r n a la i i R al e L f a s n at e o e L f a s n at e al e L f a s n at e m Job Categories r ic aw I nd r ic aw I nd r ic awI nd e it Ar ia I N or it Ar ia I N or M it o Ar ia I N or h o r e H ic s n a ll T h o r e H ic s n a al h ic r e Hic s n a F W ic om e if A a k M a W ic om e if A a k M t W om e if A a k M n k c c r n k c c n k c c al v i e v i o v i t a c A i a r as or a c A i a r as or a c A i a r as or p la at P e l o v p la at P e l o T p la at P e l o o is B N r m A w O is B N r m A w is B N r m A w T H O A T H O A T H O A T Service Workers 6% -4% -9% 1% 5% 0% 1% 0% 3% -5% -8% 2% 11% 0% -1% 2% 3% 1% -1% 0% -6% 0% 2% -2% Laborers & Helpers -39% 27% 6% 2% -1% 1% 4% 0% -20% 30% 10% 2% 0% 1% 4% 27% -19% -3% -4% 0% 0% 0% 0% -27% Operatives -19% 16% 5% 2% -8% 1% 3% 0% -10% 13% 4% 1% 7% 0% 2% 19% -9% 2% 0% 1% -15% 0% 1% -19% Craft Workers -13% 17% -5% 2% -3% 0% 3% 0% 0% 19% 1% 2% -1% 0% 3% 24% -13% -2% -6% 0% -2% 0% 0% -24% Administrative Support -11% 5% -3% 1% 6% 0% 1% 0% 15% 10% 1% 1% 9% 0% 2% 38% -26% -4% -4% 0% -2% 0% -1% -38% Sales Workers -17% 9% 3% 1% 1% 0% 3% 0% -6% 7% 3% 1% 3% 0% 2% 10% -11% 2% 0% 0% -1% 0% 1% -10% Technicians -8% 10% 0% 2% -6% 0% 1% 0% -5% 11% 0% 2% 1% 0% 1% 11% -3% -1% -1% 0% -7% 0% 0% -11% Professionals 1% 3% -1% 0% -5% 0% 1% 0% 6% 3% 0% 0% -2% 0% 1% 7% -4% 0% -1% 0% -3% 0% 0% -7% First/Mid Officials & Mgrs 5% 6% 2% 1% -15% 0% 2% 0% 10% 6% 2% 1% -10% 0% 1% 9% -5% 0% 0% 0% -4% 0% 0% -9% Exec/Sr. Officials & Mgrs -4% 1% 0% 0% 2% 2% 0% 0% 1% 1% -1% 0% 2% 1% 0% 5% -6% 0% 1% 0% -1% 1% 0% -5% Total -13% 15% 2% 2% -7% 1% 1% 0% -2% 13% 3% 1% -2% 0% 1% 16% -11% 1% -2% 0% -4% 0% 0% -16% 37 Tesla data are representative of calendar year 2020 – the latest available EEO-1 filing as of the publishing of this report. Competitor data is based on their latest publicly available disclosure. For a detailed explanation of our comparison methodology, please see page 134 of this report.
People and Culture Tesla’s diversity data (EEO-1) vs. U.S. automotive companies Diversity, Equity & Inclusion The diversity gap is even more pronounced when compared to automotive manufacturers. In nearly every job category, our employee base is more racially diverse than the automotive industry average. This is partially a function of the location of our factories. That said, our journey towards diversity, equity and inclusion is not finished and we continue to develop programs to make sure our employee base reflects the diversity of our country's population. The table below shows Tesla employee distribution compared to average employee distribution of U.S. automotive companies. Values that are higher than the Automotive company average distribution are shown with positive values and green shading. Values that are lower than the average are shown with negative values and yellow shading. Total r s Male r s Female r s o r o e o r o e a r o e in n e c in n e c in n e c a an d n e ls a an d n e t a and n e e t i a t i a i a ic i n a v a ic i n a v e a ic i n a v a r n a la i i R t a r n a la i i R r n a la i i R al e L f a s n at e o e L f a s n at e al e L f a s n at e m Job Categories r ic aw I nd r ic aw I nd r ic awI nd e it A r ia I N or it Ar ia I N or M it o Ar ia I N or h o r e H ic s n a ll T h o r e H ic s n a al h ic r e Hic s n a F W ic o m e if A a k M a W ic om e if A a k M t W om e if A a k M n k c c r n k c c n k c c al v i e v i o v i t a c A i a r as or a c A i a r as or a c A i a r as or p la at P e l o v p la at P e l o T p la at P e l o o is B N r m A w O is B N r m A w is B N r m A w T H O A T H O A T H O A T Service Workers -26% 24% -14% 2% 13% -1% 1% 0% -28% 16% -14% 2% 15% -1% -1% -11% 1% 8% 0% 0% -1% 0% 2% 11% Laborers & Helpers -21% 27% -19% 2% 5% 0% 5% 0% -16% 28% -10% 2% 4% 0% 4% 13% -5% -1% -9% 0% 1% 0% 0% -13% Operatives -32% 25% -18% 3% 19% 1% 3% 0% -24% 17% -9% 2% 14% 0% 2% 2% -8% 8% -9% 1% 5% 0% 1% -2% Craft Workers -45% 29% 0% 2% 10% 0% 4% 0% -42% 29% 0% 2% 10% 0% 4% 2% -3% 1% -1% 0% 0% 0% 0% -2% Administrative Support -29% 15% -15% 2% 22% 0% 4% 0% -1% 13% -4% 1% 15% 0% 3% 26% -27% 2% -10% 1% 7% 0% 1% -26% Sales Workers -21% 11% -5% 1% 9% 0% 4% 0% -18% 7% -2% 1% 6% 0% 3% -4% -3% 4% -2% 0% 3% 0% 2% 4% Technicians -43% 19% 2% 2% 15% 0% 4% 0% -41% 18% 2% 2% 13% 0% 3% -2% -2% 2% 0% 0% 2% 0% 0% 2% Professionals -21% 4% -5% 0% 20% 0% 2% 0% -14% 3% -2% 0% 15% 0% 2% 3% -7% 1% -2% 0% 5% 0% 1% -3% First/Mid Officials & Mgrs -14% 7% -4% 1% 7% 0% 3% 0% -10% 6% -2% 1% 4% 0% 2% 2% -5% 1% -2% 0% 2% 0% 1% -2% Exec/Sr. Officials & Mgrs -17% 0% -2% 0% 16% 2% 1% 0% -13% 0% -3% 0% 13% 0% 1% -1% -4% 0% 1% 0% 4% 1% 0% 1% Total -28% 19% -11% 2% 14% 0% 3% 0% -21% 15% -5% 2% 11% 0% 2% 4% -7% 4% -6% 0% 3% 0% 1% -4% 38 Tesla data are representative of calendar year 2020 – the latest available EEO-1 filing as of the publishing of this report. Competitor data is based on their latest publicly available disclosure. For a detailed explanation of our comparison methodology, please see page 134 of this report.
People and Culture Veterans at Tesla Diversity, Equity & Inclusion Drawing upon unique skills from their service, veterans play an essential role in achieving our goals. With dedicated veteran recruiting resources and professional development opportunities, we prioritize an inclusive and supportive environment for transitioning veterans. Tesla also supports numerous organizations that sponsor veteran hiring and have expanded outreach efforts throughout the country to more military bases and community organizations. LGBTQ+ Tesla prides itself in being a great place to work for members of the LGBTQ+ community. This is demonstrated by our 7th consecutive 100% Corporate Equality Index with the Human Rights Campaign. Tracking the size of our LGBTQ+ employee base is not a straightforward task for variety of reasons, which is why we will not be sharing specific figures in this report. 39
People and Culture Our Diversity, Equity & Inclusion governance Diversity, Equity & Inclusion Our DEI governance structure supports our business operations. Our Senior Director of People engages with our Board of Directors to ensure our DEI plans are in alignment with Tesla’s strategic objectives. We also integrate our talent management and learning and development into the DEI functional scope to ensure equitable talent, career and learning resources are accessible to all employees. The DEI Director reports directly to the Senior Director of People and has regular engagement with company executives across the company to ensure that DEI principles are embedded into our business. The DEI Director is responsible for all of Tesla’s talent management and learning programs. Diversity of our Board of Directors The diverse representation on our Board of Directors sets the tone for the rest of the company. Gender Representation – Tesla Board of Directors Female Male 25% 75% Underrepresented Communities –Tesla Board of Directors 13% 13% 0% 75% Asian Black Hispanic White Data are representative of calendar year 2021, as measured on December 31, 2021. Totals may not add to 100% due to rounding or individuals who selected “decline to state” or left the category blank. 40
People and Culture Connecting communities to opportunities with Tesla Diversity, Equity & Inclusion During the global pandemic, we focused a great deal on expanding our community engagement and ensuring our employees stayed connected. Specifically, we expanded our Employee Resource Groups (ERGs) and ensured our programming was accessible in a remote work environment. We welcomed Asian Pacific Islanders at Tesla to our ERG family. While this was a time of uncertainty and change, through our ERGs, we ensured our employees felt more heard and connected than ever before as they pivoted to virtual events to promote inclusion across different locations, physical boundaries and time zones. At Tesla, we strive to have a diverse supply chain and create the maximum practical opportunities to provide goods and services as a part of the corporate procurement process. We formalized collaboration between the DEI, Supply Chain and Government Affairs teams to ensure local minority, women, LGBTQ+, disabled and veteran owned businesses are connected to opportunities with Tesla. We recognize that supplier diversity creates a competitive advantage for the company and has a positive impact on the global community. As the supplier diversity program develops, we will implement plans that encourage increased usage of diverse suppliers throughout our organization, partner with internal and external stakeholders to identify opportunities for diverse suppliers and work with external partners to encourage capacity building for diverse suppliers. Intersectionality 41
People and Culture We strive to create an environment where people love to come to work every day. With over 100,000 Respectful Workplace employees as of March 2022, challenges arise, and we address them head on. In 2021, we re-doubled our efforts to educate employees and managers that any form of discrimination must be reported. While our goal is always prevention, reported complaints of discrimination and harassment are promptly investigated and if substantiated, subject to discipline up to and including termination. New employees receive anti-harassment and discrimination training during orientation. A new employee guidebook was also rolled out which instructs employees to report all forms of misconduct without concern. As the company continues to hire tens of thousands of workers per year, educating our workforce is a top priority and an ongoing process. 42
People and Culture How we're meeting our commitments to equal opportunity employment and a diverse and inclusive Respectful Workplace environment We believe it’s essential to provide all employees with a respectful and safe working environment where all employees can achieve their potential. As a result, we do not tolerate discrimination, harassment or any mistreatment of employees in the workplace or work-related situations. Below are some of the actions we are taking to ensure the proper treatment of all employees. Training: Code of Business Ethics and harassment & discrimination training for front-line leaders, HR partners and other employees to understand how to create and promote a respectful workplace, assess situations sooner and escalate appropriately. Internal Tracking System Enhancement: An enhancement to our internal tracking system now allows HR to document all employee concerns that are raised to ensure there is follow through and resolution for tracking purposes. Additionally, handling concerns at the initial stage helps prevent them from becoming bigger issues. The case management system also allows the appropriate teams to review data to trend and issue spot, which then can lead to proactive solutions before concerns arise. Internal Mobility: A program that advocates for and provides equal access to employee advancement opportunities and retention with eligibility for opportunities based on standardized performance reviews. Opportunities are advertised on an internal site with career resources in addition to a monthly newsletter. We also offer 1-on-1 support and personal consultations to understand the career aspirations of internal applicants. Third-party managed integrity line We encourage employees to raise concerns internally or externally. An employee can raise concerns or complaints to any member of management, Human Resources or Employee Relations (ER). If they prefer to report another way, the Integrity Line is available 24 hours a day, seven days a week. The Integrity Line allows employees to report concerns anonymously and without fear of retaliation. If any employee raises a good faith concern, HR, together with ER, will ensure that employee concerns are investigated promptly and impartially in a manner appropriate to the circumstances. The Employee Relations team engages in feedback loops with leaders and HR to provide guidance on any appropriate follow-up actions, which range from additional communication and training to corrective action and discipline up to termination of employment. 43
People and Culture Why engagement matters for retention Employee Engagement Employee engagement drives productivity, satisfaction and loyalty and plays a critical role in employee retention. Tesla’s engagement initiatives strive to make employees feel informed, valued and respected, while company-wide open-door policies with leaders empower employees to make their ideas heard. When we feel connected to the Tesla community and mission, we unlock our full potential as a workforce. What we are doing to keep employees engaged To promote engagement, we lead initiatives driven by employee feedback. Throughout the year, we use roundtables, engagement surveys and other feedback forms to gather data and better understand the employee experience. Our team uses this data to inform our communication strategies. In addition to a monthly newsletter emailed to all U.S. employees and physically posted at manufacturing sites, we launched a new company-wide internal news platform with weekly updates on company news, employee recognition and events. We highlight business, people and safety updates via both email and an expansive network of video screens. In 2021, we also produced two live and virtual companywide all-hands. These channels pair with the revitalization of daily Start-Up meetings for assembly workers to streamline communications across the Fremont Factory. HR members also staff on-site Answer Bar kiosks to address employee questions and concerns at many of our office locations. Engagement requires making resources more accessible. This translates to regular on-site tabling and fairs for benefits, as well as making information available digitally. We manage internal resource websites for product knowledge, employee perks, recognition, employee volunteering, health and fitness and offer virtual info sessions with subject matter experts. 44
People and Culture Supporting Ukraine Disaster Relief We are committed to providing disaster relief through product donations. Our relief efforts to the conflict in Ukraine have provided people with the ability to communicate and power communities. In March 2022, Tesla employees in Europe volunteered to design, prototype and deploy the first 50 kits containing Powerwalls, Gateways and solar inverters to support continued energy access in Ukraine. When paired with one of the 250 solar panels dispatched by volunteers at Gigafactory Berlin, these mini power plants can assist Ukrainian communications and essential services indefinitely by using solar to recharge Powerwalls. Along with Starlink Terminals used for satellite internet access (made by SpaceX), the kits were shipped to the Ukranian border in Poland, at which point they were transferred onto military trucks. The kit can begin providing power almost instantly, without any tools or technical experience required. With the Powerwall kit alone, a user can power Starlink for five days. With solar panels installed and operational, the kits can provide indefinite power for Starlink Terminal, plus a small appliance or laptop. Surrounding European countries In addition to product donations, Tesla has opened free Supercharging at all stations in Poland, Slovakia and Hungary to support those impacted by the recent events. Within hours of implementation, Tesla emailed local owners announcing that several Supercharger stations near Ukraine could be used by Tesla and non-Tesla electric vehicles, free-of-charge. 45
People and Culture Hurricane Ida Disaster Relief In the aftermath of Hurricane Ida, Tesla worked with NGO partners such as the Footprint Project, and certified installers in the New Orleans Area (Solar Alternatives, Posigen) to deploy Powerwall and solar panel disaster relief systems. We deployed 14 systems to over 10 sites, including food distribution centers, churches, a warehouse, a fire station, a shelter and command center for NGOs. Most systems stayed in place for six weeks while the grid was down; in cases where the building was too damaged to return power after the grid was back up the systems remained in place for substantially longer. Our partners estimate that these systems provided power to over 1,000 people including recovery workers, food distribution volunteers and first responders. Kentucky Storms After the Kentucky winter storms, we deployed two systems at a research and education center in Princeton, Kentucky in partnership with the Footprint Project. These systems helped power communications trailers and mobile offices for over 50 recovery workers. They are still deployed while the center is being rebuilt and we are exploring ways to turn the trailers and mobile offices into a training center for future recovery workers. Texas Winter Storm In February 2021, Texas experienced a weather event that caused the widespread loss of power for several days affecting thousands of residents. Tesla provided a disaster relief system to Pathways Youth & Family Services, Inc., a non-profit social service organization providing foster care, adoption and behavioral health services to communities across Texas. The system consisted of four mobile Powerwall units (for a total of ~100kWh of batteries and 40kW of power). With this system, Pathways was able to restore heat and power to its facilities, enabling it to resume housing and other social services to children. 46
People and Culture In 2021, our focus remained on protecting people, the planet, our property and products. We were able to Safety improve our performance in Environmental, Health, Safety and Security (EHS&S) by turning to the experts in Tesla – our own employees. We evolved the way we define safety, developed internal tools to drive execution, actively sought worker improvement suggestions and established a more structured EHS&S audit program to identify safeguards and drive operational excellence throughout all areas of the business. Our EHS&S strategy remains focused on three pillars: 1. Do the Basics Right | 2. Engage and Empower Our Stakeholders | 3. Reduce Risk Changing how we define safety and build capacity: Human and Organizational Performance (HOP) and Operational Learning As we grew and evolved as an EHS&S organization, so did our view of safety. The Human and Organizational Performance (HOP) and Operational Learning group was developed in 2021 to integrate our new view of safety into the organization. In an ever-changing and dynamic work environment, we recognized the need to focus on creating the ability to fail safely. Creating the ability to fail safely is comprised of three components: 1. Engaged workers: workers who are connected to and care about the work they do. When workers are engaged, they are more likely to identify and communicate vulnerabilities in the system. 2. Agility: the ability to continuously navigate and adapt in an ever-changing, complex and dynamic work environment. 3. Safeguards: the hardware, software and human actions that directly prevent an event or mitigate a bad outcome. Instead of defining safety as the absence of accidents, we define safety as the presence of capacity. Capacity can be defined as the ability to mitigate outcomes and reduce system brittleness. 47
People and Culture Develop tools to drive execution of EHS&S —MyEHS Safety – MyEHS & Take Charge In order to build capacity and allow our workers to fail safely, we needed a more dynamic approach to how we collect and manage data that allows us to make decisions that reduce risk. In response to that need, we developed an internal EHS&S tool named MyEHS to help drive execution and improve outcomes by allowing the intake and visualization of data globally. We designed and deployed 11 modules in 2021, allowing us to better manage our EHS&S information, identify emerging risks and take action to implement improvements suggested by our employees. 48,779 submissions Foremost in this effort was our improvement suggestion module — Take Charge. Combined with Action Tracker, 72% of submissions closed with action this module allows workers to submit improvement suggestions in various categories, including environment, health, safety, security, people and accuracy, while connecting with their supervisors and other work groups to identify and implement solutions to improve the presence of safeguards. Take Charge case study — Sherry Ihrig Leading the way with Take Charge submissions is Sherry Ihrig, with over 1,800 improvement suggestions to safety, processes, cost-savings and more since the program’s start in early 2021. “Tesla promotes the concept that ‘safety is a shared responsibility,’ and the Take Charge program truly empowers me to take a more active role in sharing that responsibility,” Ihrig said. “The Take Charge program encourages associates to increase their awareness of the work environment,” Ihrig said. “When these and other potential safety hazards are noticed and resolved, it allows associates to improve their overall work performance.” While Ihrig has enjoyed many parts of her experience at Tesla, from teaming up with “hardworking, outgoing individuals” to learning how to operate a fire extinguisher in emergency response training, the most exciting part has been the Take Charge program. Meet Sherry Ihrig – Take Charge Champion Engaged employees like Sherry help Tesla build capacity to ensure safeguards are in place and functioning, so that when we fail, we fail safely. 48
People and Culture COVID-19 response Safety – Protecting our People Since the emergence of COVID-19 in 2019 and the subsequent variants, we have proactively protected our workers. Teams have contributed to country, state and local regulations to ensure the voice of industry was represented in the drafting and implementation of policies. Our pandemic management team continues to engage with employees at all levels. We consistently re-examine operations through risk assessments as a key element for managing the ever-changing COVID-19 work environment. Our dedicated Infectious Disease Team aggressively monitors on-going changes across the world to stay healthy and compliant with the differences in localities. Stats: • Conducted 59 free, on-site COVID-19 vaccination clinics • Administered 14,811 COVID-19 vaccinations • Received vaccination and booster information from 48% of employees using our internal tracking system, helping monitor progress • Gifted employees $86,500 in cash and prizes to encourage vaccinations Compliance & Audit Group Established We established the Compliance Audit Program in 2021 to provide an objective assessment of the management of EHS&S risk at a site level throughout the various businesses. We have conducted 31 audits so far that: • Focused on compliance with Tesla EHS&S standards and regulatory requirements • Engaged site-level EHS&S professionals to audit other Tesla sites, maximizing technical knowledge across the businesses • Identified best practices that can be replicated across other sites • Provided guidance and assistance to sites addressing and closing out corrective and preventive actions The audit outcomes provided opportunities for workers to identify and employ improvement solutions, adjust to the changing work environment where necessary, verify and validate existing safeguards, and implement new safeguards and improve our overall capacity. 49
People and Culture U.S. Occupational Safety and Health Administration (OSHA) Voluntary Protection Program (VPP) application Safety – Protecting our People accepted in GF Nevada Gigafactory Nevada became the first Tesla site to have a Voluntary Protection Program (VPP) application accepted. VPP is an OSHA program that recognizes employers in the private industry who have implemented effective safety and health management systems and maintain injury and illness rates below national Bureau of Labor Statistics averages for their respective industries. Next step will be a rigorous onsite evaluation by a team of health and safety professionals in May 2022. Security Security of our people, the planet, our property and products continues to be a core factor to enable production execution and build capacity throughout our entire organization. Our manufacturing locations have dedicated physical and technical security teams, while at our service centers and remote sites, we augment physical security with our SHIELD ambassadors. SHIELD is Tesla's Security Ambassador project that helps increase security awareness at all Tesla locations, especially those without an on-site security team. The Tesla SHIELD program is designed to educate individuals with the basic security requirements for their building, to allow them to present the issues to their site manager for resolution and be able to escalate larger issues to the Security Team for support. • 271 Security SHIELD Ambassadors registered at 176 locations across 24 countries to help support on-site security needs • 37,154 workers trained in basic security and awareness courses 50
People and Culture As our production volumes increase, focus on safety remains strong Safety – Metrics As we continue to increase production, our focus remains on maintaining positive safety records. We examine our safety data to identify emerging risks, comparable events for innovative solutions and to better understand how we can systematically improve across our highest risk areas to help keep our people, the planet, our products and property safe. We have turned our attention away from traditional OSHA metrics, but we continue to maintain information on them for regulatory purposes. We use these metrics, amongst many others, to examine how how we can see the results of our commitment to safety. This will be the last year that we present recordable injuries per car produced – which captures all injuries and illness regardless of their severity or relation to work. Instead, we will use the American Society for Testing and Materials (ASTM) standard E2920-19. ASTM better represents our global reach and more clearly illuminates serious injuries and illnesses, allowing our focus to remain on preventing and mitigating outcomes of our highest-risk activities. Global Recordable Injuries per 1,000 cars 8.0 7.5 1,000,000 6.0 750,000 4.9 4.0 3.3 500,000 2.9 2.0 250,000 0.0 0 2018 2019 2020 2021 Recordable injuries Cars produced 51
People and Culture Fremont Factory DART rate stays below industry average Safety – Metrics As our manufacturing footprint expanded into Austin and Berlin, and our Shanghai location accelerated production, Fremont continued with the unwavering manufacturing of all Tesla cars. Fremont Days Away, Restricted or Transferred (DART) rate has remained below the North American Industry Classification System (NAICS) average for automobile manufacturing for the previous three years and continues to drive performance through the integration of safety in design and the verification and validation of safeguards. In order to concentrate on the events that matter most, we have made great efforts to increase our focus on events of significant consequence. We continue to track and report on OSHA statistics for our U.S.-based sites, such as DART rates for more serious injuries/illnesses, but we are shifting our view to be more forward thinking and globally inclusive. DART Rate — Fremont Factory 6.0 5.0 4.9 4.4 4.4 4.0 3.5 3.0 2.0 1.0 0.0 2018 2019 2020 2021 DART Rate Industry Average 52
People and Culture How we measure success globally — prevention of serious injuries and fatalities Safety – Metrics We transitioned to the ASTM standard E2920-19 as our global metric in 2020 to better reflect our global presence and have an increased focus on serious injuries and illnesses. Other automakers have not yet adopted this standard, so we are benchmarking against other manufacturing and service industries. We made this change in response to studies indicating the statistical invalidity of previous metrics (Total Recordable Injury Rate [TRIR]) as measures of safety outcomes. We continue to concentrate our prevention and mitigation efforts in our highest risk areas across all lines of business and are accelerating forward with our strategies to ensure essential safeguards are in place and functioning. In 2020, COVID–19 impacted our operations including the shutdown of the Fremont Factory; therefore, we are using 2021 as our baseline year. Sadly in 2021, Tesla experienced a fatality which occurred during a vehicle test drive outside of the U.S. Extensive global actions have been implemented based on our operational learning including limiting speeds and designated test drive routes. Global Serious Injury Rate 4 3.58 3.63 3 2.60 2 1 0 * 2020 2021 Industry Average 53 *Industry Average data is taken from manufacturing/service industries submitted to ORCHSE/NSC for the years 2019 & 2020
People and Culture Constructing Our Future Safety – Constructing Our Future In 2021, we kicked off our Constructing Our Future initiative that focused on empowering our project teams and partners to accelerate contractor onboarding as well as to simplify our requirements to ensure work is conducted safely and effectively. Rather than uploading a Job Hazard Analysis (JHA) completed off-site, contractors and suppliers are now expected to meet a Tesla Responsible Person and EHS&S professional at the location of work to complete a Pre-Work Risk Assessment. Over 5,000 companies were onboarded, and 587 Tesla Responsible Persons (TRP) and Contractor Responsible Persons (CRP) were trained in the new process. This level of involvement resulted in increased contractor responsibility, improved communication and more thorough Pre-Work Risk Assessments, which identified critical and high-risk activities. Shifting from a hazard-based approach to a risk-based approach provides a better opportunity for EHS&S success by discussing critical and high-risk operations. In addition, we support the Constructing Our Future with written procedures, training resources and forms which are easily accessible to Tesla stakeholders. This strategic approach helps us create the framework necessary to build safely, efficiently and consistently. We are on schedule to release the new and improved supplier and contractor onboarding and management system, Workforce Management, in the second quarter of 2022. This simple, scalable, centralized system will build on the efficiencies of the interim onboarding process and provide better visibility for managers and engineers to track performance. We will report our contractor injury rates in the 2022 Impact Report. 54
Environmental Impact 55
Introduction What Do We See As Impact? The biggest environmental impact is achieved through early displacement of ICE vehicles and replacing them with EVs. Additionally, we want to displace fossil-based energy generation with renewable energy generation. As of the end of 2021, Tesla (including SolarCity prior to its 2016 acquisition by Tesla) has installed almost 4.0 Gigawatts of solar systems and cumulatively generated over 25.0 Terawatt-hours (TWhs) of emissions-free electricity. For reference, that is more energy generated by our installations than the total energy Tesla has used to run all our factories since we began producing Model S in 2012 and electricity used to power all of our vehicles in that same period combined. We are striving to always remain a net contributor to renewable energy generation. It is our goal to eventually have all our manufacturing energy needs satisfied through renewable sources where possible. Additionally, we are hoping to see more Tesla vehicle customers installing solar panels or Solar Roof along with a Powerwall to meet their own energy needs in a sustainable way. Energy Generation vs. Energy Consumption (in TWh) 56
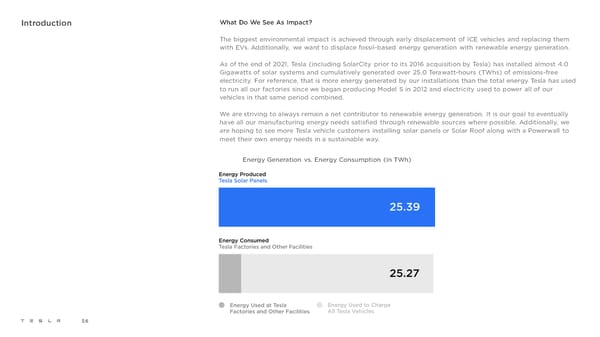
Introduction In addition to an updated Lifecycle Analysis (LCA) for Model 3 and Model Y, we are reporting total Scope 1 and Scope 2 emissions and use-phase emissions of our vehicles In this year’s report we are reporting our Scope 1 (direct emissions from our facilities) and Scope 2 (purchased electricity, heat, etc. for our facilities) emissions resulting from global operations. This information is not only important to benchmark our performance against other manufacturers but is also the first step to track progress as we continue to work to decarbonize our own operations. While the most important work we can do to reduce GHG emissions is through selling as many of our products as possible, we are also committed to reducing carbon emitted from our own operations longer term. This is not only the right thing to do, but it also makes business sense as we reduce the resource intensity of our processes. It is possible to fully decarbonize the manufacturing and use of EVs – this is economically unfeasible for ICE vehicles We are often asked if electric vehicles (EVs) are more sustainable than internal combustion engine (ICE) vehicles. The environmental impact of zero-emission transport and energy products, like the products that Tesla produces and sells, is undeniably more positive than the GHG-emitting alternatives. This becomes more pronounced when determining the lifetime impact of EVs versus ICE vehicles, which requires looking at the entire lifecycle — from raw materials to use-phase emissions to disposal — and not just at vehicle usage emissions. Variables often overlooked by other lifecycle studies: • Using Worldwide Harmonized Light Vehicle Test Procedure (WLTP) or Environmental Protection Agency (EPA) fuel/energy consumption data (both of which overestimate fuel-economy and underestimate emissions) rather than real-world data 6,500 miles • Not considering the higher energy efficiency of Tesla’s powertrains The manufacturing process of Model 3 and Model Y currently results • Assuming the average EV needs a battery replacement at some point in its life (it doesn’t) in slightly higher GHG emissions than an equivalent combustion • Not considering emissions generated through the oil refining and the transportation process engine vehicle. However, based on the global weighted average grid mix, Model 3 and Model Y have lower lifetime emissions than an • Using outdated data for the carbon impact of cell manufacturing equivalent ICE after driving 6,500 miles. 57 *For a definition of Scope 1, 2 and 3 emissions see page 135 of this report.
1 Lifecycle Analysis of Tesla EVs vs. Using only real-world data, not official NEDC, WLPT or EPA consumption data Equivalent ICE Vehicles The most important variable in a lifecycle analysis of an automobile is real-world fuel consumption or electricity consumption, as applicable, which impacts the use-phase of the lifecycle. Various efficiency testing cycles such as NEDC, WLTP or EPA do not truly represent real-world fuel or energy consumption. Therefore, we used: EV energy consumption: Real world energy consumption based on 25 billion miles traveled Tesla Model 3 and Model Y vehicles, including energy losses during the charging process. 70 tons ICE fuel consumption: Data provided by Consumer Reports, which reports model year 2020 mid-size premium sedans achieve 24.3 MPG on average. This translates to over 400 grams of CO2e per mile once we account for Lifetime CO e emitted by an average internal combustion engine 2 emissions generated through the extraction, refining and shipment of oil. vehicle (model year 2021) sold in the U.S. through its use-phase, excluding CO2e emitted during the oil refining phase. The carbon impact of ICE vehicles remains the same every year of use, but for EVs, it should improve every year Based on publicly available sales and fleet data, we estimate that an average vehicle in the U.S. is driven slightly less than 12,000 miles per year for about 17 years before it is scrapped. Furthermore, as an ICE vehicle ages, its fuel efficiency only remains stable if serviced properly. On the other hand, electricity generation to charge EVs has become “greener” over time with the addition of cleaner energy sources to the grid. Below, we show zero- emission electricity generation capacity (including nuclear) in the U.S. since 2015. Even without factoring in any changes to federal policy or an acceleration of the adoption of renewables in the U.S. (which is likely), if current trends remain stable, emissions generated through EV charging should continue to decline over time. U.S. Electricity Grid Generation Mix (assuming continuation of recent tends) 80% Average U.S. vehicle lifetime 60% 40% 20% 0% Nuclear Zero-Emission Sources 58 1NEDC = New European Driving Cycle; WLPT = Worldwide Harmonized Light Vehicles Test Procedure; EPA = U.S. Environmental Protection Agency 22021-2040 Tesla estimate based on recent grid mix shifts. Conservatively assumes no change in federal policy or acceleration of move to renewables in the U.S. for electricity generation.
Lifecycle Analysis of Tesla EVs vs. On the following pages, we will show the per mile lifecycle emissions of our vehicles Equivalent ICE Vehicles This includes emissions from upstream supply chain, direct emissions from manufacturing and electricity consumption and use-phase emissions when charged from a grid with a generation mix that reflects the geographic distribution of Model 3 and Model Y deliveries in the U.S., Europe and China. Below are the lifecycle emissions scenarios we show, and the assumptions used in each of the charts on the following pages: Average Premium ICE: The reference ICE vehicle is based on an average of mid-size premium sedans and mid- size premium crossover SUVs, with a real-world fuel economy of 24.3 MPG. Model 3/Y* Personal Use (Grid Charged): What emissions per mile could be if a Model 3/Y were principally charged at home from the grid. Model 3/Y Ridesharing Use (Grid Charged): What emissions per mile could be if a Model 3/Y were used for ridesharing over one million miles using cell chemistry from Tesla energy products, charged from the grid. Model 3/Y Personal Use (Solar Charged): What emissions per mile could be if a Model 3/Y were principally charged at home using a solar system and energy storage. Model 3/Y Ridesharing Use (Solar Charged): What emissions per mile could be if a Model 3/Y were used for ridesharing over one million miles using cell chemistry from our energy products and if it were only charged using a solar system and energy storage. Other assumptions: • Charging a Model 3/Y using solar panels and a Powerwall adds emissions to the manufacturing phase while reducing use-phase emissions to as low as zero when 100% of charging is done using that system. • We conservatively assume no additional renewable energy capacity on the grid during the life of the vehicle given the shape of the renewable energy adoption curve is still very much up for debate. • Manufacturing phase emissions for Model 3/Y in the U.S. represent a Fremont-made vehicle, while manufacturing phase emissions in Europe and China represent a China-made vehicle. * This year we have added the impact of Model Y to the emissions per mile calculation in our LCA. Given that Model 3 and Model Y have 70%+ parts commonality and share many manufacturing processes their GHG footprints are very similar. We have decided to present the LCA as a 59 weighted average of Model 3 and Model Y based on production share for each vehicle (for manufacturing phase emissions) and delivery volumes in each region (for use-phase emissions).
EV vs. ICE Vehicle Emissions per Mile The electricity grid keeps getting cleaner, while emissions from ICE vehicles do not United States To put this in perspective, average GHG emissions from charging one New York-based Tesla vehicle equates to the emissions from an ICE vehicle with a fuel economy of 109 MPG (no such vehicle is on the market). Even when charging a Tesla in Michigan, where approximately 60% of energy comes from natural gas and coal, the emissions from our vehicles still equates to the emissions from an ICE vehicle with 52 real-world MPG (considerably more in terms of EPA rated MPG). As more regions adopt sustainable energy solutions to generate power, emissions related to charging an EV from the grid will decrease even further. EV customers can increase their renewable energy mix by installing solar panels or a Solar Roof and an energy storage solution, such as Powerwall, in their homes. This dramatically reduces the lifetime carbon footprint of an EV, even when accounting for the carbon footprint of both the solar panel/Solar Roof and Powerwall manufacturing and upstream supply chain. Average Lifecycle Emissions in U.S. (gCO2e/mi)* Average Lifecycle Emissions in New York State (gCO2e/mi)* 500 500 400 400 300 300 Shift to 200 greener 200 grid 100 100 0 0 Model 3Y Model 3Y Model 3Y Model 3Y Average Model 3Y Model 3Y Model 3Y Model 3Y Average Ridesharing Use Personal Use Ridesharing Use Personal Use Premium ICE Ridesharing Use Personal Use Ridesharing Use Personal Use Premium ICE (solar charged) (solar charged) (grid charged) (grid charged) (solar charged) (solar charged) (grid charged) (grid charged) Manufacturing Phase Use Phase Manufacturing Phase Use Phase *gCO2e/mi = grams of CO -equivalent per mile driven 60 2
EV vs. ICE Vehicle Emissions per Mile A cleaner grid in Europe means a bigger emissions gap between Model 3 and a comparable ICE vehicle European Union, U.K. & EFTA In Europe, the U.K. and EFTA (Iceland, Liechtenstein, Norway and Switzerland), larger portions of energy generation come from either renewable sources or nuclear, which means that in Europe the use-phase emissions gap between ICEs and EVs is even wider than it is in the U.S. On the other hand, since an average European driver covers fewer miles per year than a U.S. driver, emissions from the manufacturing phase are divided by fewer miles. While in the U.S., an average vehicle covers 200,000 miles before getting scrapped, in Europe, total mileage is closer to 150,000 miles. We used Austria as an example of how use-phase emissions should evolve once the European grid becomes greener. As seen in the chart on the right, in Austria, all-in lifecycle emissions of a personal, grid-charged Model 3Y are over 3.5x lower than all-in lifecycle emissions of an equivalent ICE vehicle. Average Lifecycle Emissions in Europe (gCO2e/mi) Average Lifecycle Emissions in Austria (gCO2e/mi) 500 500 400 400 300 300 Shift to 200 greener 200 grid 100 100 0 0 Model 3Y Model 3Y Model 3Y Model 3Y Average Model 3Y Model 3Y Model 3Y Model 3Y Average Ridesharing Use Personal Use Ridesharing Use Personal Use Premium ICE Ridesharing Use Personal Use Ridesharing Use Personal Use Premium ICE (solar charged) (solar charged) (grid charged) (grid charged) (solar charged) (solar charged) (grid charged) (grid charged) Manufacturing Phase Use Phase Manufacturing Phase Use Phase 61
EV vs. ICE Vehicle Emissions per Mile Despite a higher-emissions grid in China, Model 3 still has lower emissions than comparable ICE vehicles China In China, much of the grid is powered by coal. That said, even in this scenario, charging a Tesla Model 3Y from the grid is still less emission intensive than running an ICE vehicle. Just like in Europe, we have assumed a vehicle lifetime of 150,000 miles. We are expecting the grid mix in China to improve dramatically over time as China remains a dominant deployer and manufacturer of renewable energy. Sichuan Province (with a population of 81 million) is a great example of this. In this province, given the high percentage of renewable energy penetration, charging an EV from the grid is less polluting than charging an EV in most global countries or states. In conclusion, even as of 2021, charging a Tesla Model 3Y in any of our major markets is more environmentally friendly than burning gasoline. Considering that vehicles are used for 17 to 20 years before getting scrapped, it is reasonable to assume that in the coming years, the gap in emissions per mile between EVs and ICEs will only get wider. Average Lifecycle Emissions in China (gCO e/mi) Average Lifecycle Emissions in Sichuan Province (gCO e/mi) 2 2 500 500 400 400 300 300 Shift to 200 greener 200 grid 100 100 0 0 Model 3Y Model 3Y Model 3Y Model 3Y Average Model 3Y Model 3Y Model 3Y Model 3Y Average Ridesharing Use Personal Use Ridesharing Use Personal Use Premium ICE Ridesharing Use Personal Use Ridesharing Use Personal Use Premium ICE (solar charged) (solar charged) (grid charged) (grid charged) (solar charged) (solar charged) (grid charged) (grid charged) Manufacturing Phase Use Phase Manufacturing Phase Use Phase 62
Reducing Carbon Footprint Even Further More efficiency than a Prius, performance of a Porsche Improving Powertrain Efficiency Tesla vehicles are among the most efficient EVs built to date. In the early days of Model S production, we were able to achieve energy efficiency of 3.1 EPA miles / kWh. Model Y All-Wheel Drive (AWD) achieves 4.1 EPA miles / kWh, which makes it the most efficient electric SUV produced to date. The gap between Tesla AWD vehicle efficiency continues to stand out compared to competitors in the same segment. While achieving the best-in- class energy efficiency, our AWD models can accelerate to 60 mph in just 4.2 seconds (4.8s for Model Y) and reach a top speed of 145 mph (135 mph for Model Y). In isolation, high energy efficiency is already difficult to achieve, but getting both performance and efficiency is the tricky part. Tesla Robotaxis will be even more energy efficient The energy efficiency of Tesla vehicles will continue to improve as we improve our technology and powertrain efficiency. It is also reasonable to assume that our high-mileage products, such as our future Tesla Robotaxis, will be designed for maximum energy efficiency as handling, acceleration and top speed become less relevant. This will minimize cost for our customers as well as reduce the carbon footprint per mile driven. Energy Efficiency — EPA range in miles/kWh Energy Efficiency — EPA range in miles/kWh Small SUVs (AWD) Mid-Sized Sedans (AWD) 5 5 4 4 3 3 2 2 1 1 0 0 Model Y VW Ford Jaguar Audi Model 3 Polestar 2 BMW Audi e-tron ID.4 Mach E iPace e-tron i4 M50 Sportsback 63 Source: OEM websites and other publicly available sources
Reducing Carbon Footprint Even Further 1. Building new, better designed and more efficient factories Tesla Manufacturing Footprint: Current Actions Building a factory from the ground up with sustainability in mind can have a material impact on reducing energy use. For each component that requires less movement around the factory, and as we use fewer robots in the vehicle production process, energy consumption declines. In our quest for constant improvement, we build each new factory to be better and more sustainable than the previous one. For example, at Gigafactory Texas, we chose highly efficient, insulated, low emissivity windows to reduce building heating and cooling demand. In addition, waste heat recovery from our compressors alone will offset over 1 MW of natural gas consumption for process heating. While we have already completed substantial improvements at Gigafactory Shanghai, further improvements will continue at Gigafactory Berlin-Brandenburg and Gigafactory Texas. Model 3 in Fremont, CA Model 3 in Gigafactory Shanghai kWh of Energy per Vehicle Produced Fremont Shanghai 64
Reducing Carbon Footprint Even Further 2. Covering roof space with solar panels Tesla Manufacturing Footprint: Current Actions All our new factories are designed to be covered with solar panels. As of the end of 2021, we had installed solar panels with a capacity of 21,405 kW, with the vast majority installed on the roofs of Gigafactory Nevada, Gigafactory New York and our manufacturing facilities in California. We will continue to add more capacity to these and other facilities as space allows and as is economically feasible. 3. Leveraging AI to make our factories more efficient We are leveraging six years of sensor data from Gigafactory Nevada to train an artificial intelligence (AI) program to safely control 195 interconnected HVAC units, accounting for 6MW of total electrical load. In its first full year of operation, we have measured significant load reduction compared to baseline usage. For such comparison, we look at actual energy usage for the HVAC system for the two modes under the same conditions (operations in the factory, time of year, external temperature, etc.). AI control is expected to achieve significant energy savings for Tesla as it is scaled up to control a majority share of HVAC equipment at Gigafactory Nevada as well as HVAC equipment at other Gigafactories. 65
Reducing Carbon Footprint Even Further We will not be content until all our factories are carbon neutral, and there are other projects that we are Tesla Manufacturing Footprint: working on to further reduce emissions. In order to reduce the cost of our vehicles and batteries, we also need Upcoming Plans to use less energy to produce them. Many of the projects created to achieve this goal were showcased at our Battery Day presentation in September 2020. 4. Transitioning to in-house manufactured 4680 Tesla cells, whose production process can reduce energy consumption by more than 70% At Tesla’s 2020 Battery Day, we presented a novel way that cells can be manufactured using a dry electrode process. Current electrode production processes involve mixing liquids with cathode or anode powders and using massive machinery to coat and dry the electrode. Since this process involves large ovens, today’s cell production consumes a lot of energy. The new dry-electrode process allows for the direct transition from a cathode or anode powder to an electrode film, reducing energy consumption in the overall cell manufacturing phase by more than 70% based on our latest analysis. 5. Utilizing renewable energy as much as possible throughout all our operations We plan to shift energy consumption toward renewables as quickly as possible throughout our operations, whether it is at our factories, sales, service or delivery locations or through our Supercharger network. 66
Reducing Carbon Footprint Even Further Our batteries are designed to function for the entire life of the vehicle Increasing Vehicle Utilization Tesla’s battery packs are designed to outlast the vehicle. We estimate that a vehicle gets scrapped after approximately 200,000 miles of usage in the U.S. and roughly 150,000 miles in Europe. Creating a battery that could last for 1,000,000 miles (4,000 charging cycles) would dramatically reduce the emissions per mile driven for high-mileage vehicles such as taxis, delivery vans or trucks. Producing Robotaxis is a core part of our mission. All vehicles in the world combined travel trillions of miles every year. A relatively small number of vehicles, such as taxis, delivery vans, trucks and buses account for a disproportionate amount of vehicle miles and, as a result, a disproportionate amount of emissions. A single future Tesla vehicle with a million-mile battery could be utilized over five-times more than an average vehicle in the U.S. After being fully optimized, and even once it is scrapped, a battery can still be recycled and its materials used in a brand-new battery. Tesla Model S/X Battery Capacity Retention per Distance Traveled 100% 80% Standard Deviation Retention 60% 40% 20% 0% 0 25 50 75 100 125 150 175 200 Distance Traveled (thousands of miles) Note: Mileage is only one factor in battery capacity retention; battery age is also a major factor. Retention figures at lower mileages above likely reflect the impact of age while higher mileage values, which come from high-utilization vehicles, likely reflect less influence from battery age. 67 Performance of newer chemistries (not yet shown here) can vary and we plan to expand disclosure once we have sufficient data.
GHG Emissions We can make the biggest impact on GHG emissions by selling as many of our products as possible. Scope 1, 2 and 3 Undoubtedly, the use-phase of our products avoids more lifetime emissions than either our operations or our supply chain could. However, in support of our mission, we track and try to minimize emissions that result from our full value chain, including our supply chain, manufacturing processes as well as our sales, service and delivery activities. In 2021, we began measuring our Scope 1 and Scope 2 GHG emissions considering the principles and guidance of the GHG Protocol. We used the operational control approach methodology – accounting for GHG emissions from operations under our control. For detailed information on the scope of our calculations, please see page 139-142 of this report. While our total Scope 1 and Scope 2 emissions may increase on an absolute basis in the near term as we continue to open new factories, our goal is to reduce the emissions intensity from production as we push the boundaries of sustainable manufacturing and improve the efficiency of our operations. As part of our commitment to reducing our overall emissions in the long term we signed up for the Science-Based Target Initiative (SBTi) in 2021. 1 2 Metric Unit of Measure Manufacturing SSD Other TOTAL Scope 1 GHG emissions tCO2e 124,000 31,000 30,000 185,000* Scope 2 GHG emissions tCO e 342,000 35,000 26,000 403,000* (location-based) 2 Scope 3 | Category 11: Use of Sold Products tCO2e 1,954,000 (EV charging) 1 SSD = Sales, Service & Delivery 2 Other includes sites that conduct research & development, administration, energy product warehousing and deployment, and other mixed-used warehousing. *PwC performed an attest review engagement on this metric. See their report on page 138. 68
GHG Emissions Scope 3 GHG emissions calculations are highly academic, even those widely used and accepted like the GHG Scope 3 Emissions Protocol. Most companies lack primary data as it relates to their supply chain, product use and so on. Therefore, most Scope 3 GHG emissions reporting is done using lofty assumptions as well as estimates from databases – this can lead to figures that are magnitudes off from the actual impact. Tesla has begun to measure the two largest categories within our Scope 3 emissions: those from use of product and our supply chain. Use of product emissions Tesla has access to primary data from our over two million vehicles on the road and our fleet of solar and storage products — we can calculate our emissions at a much higher level of accuracy than most manufactures and can therefore develop emissions reduction solutions to match. This also means that we can calculate our use of product emissions year on year —we do not have to estimate emissions over the lifetime of the vehicle because we have primary data. Supply chain emissions Prioritizing our supply chain is crucial and we have a lot of work to do to incentivize suppliers to provide energy and emissions data for us to report on. We have already started to identify which materials and processes in our supply chain are key emitters so we can prioritize engagement and projects to address these emissions — see the Supply Chain section for more detail. The good thing for us is that Tesla’s high level of vertical integration and our direct sourcing relationships mean we are positioned to manage upstream emissions better than most. 100% Renewable Supercharger network Efficiency of an ICE vehicle does not improve throughout its lifetime. EVs will get cleaner over their lifetime as the grid becomes greener. We will continue to look for ways to enable our customers to further reduce their emissions beyond our vehicles — through solar and storage products and software to help differentiate when the grid is greener and pulling more renewable energy like solar or wind. The global Supercharger network was 100% renewable in 2021, achieved through a combination of onsite resources and annual renewable matching. Additionally, all home charging in California was 100% renewable through annual renewable matching. Therefore, the only emissions from the use of Tesla vehicles were a result of home charging outside of California and use of third-party charging networks. 69
NOx, Particulates and Other Pollutants Pollution from burning fossil fuels leads to eight million premature deaths globally each year Environmental Research by Harvard University, in collaboration with According to recently published research in the University of Birmingham, the University of Leicester and University College London, air pollution causes over eight million premature deaths annually. That is double the previous estimate of deaths from the negative effects of fine-particle pollution and would account for one-in-five premature deaths worldwide. This is a major advantage of EVs that is often forgotten about as the overall EV debate tends to focus on greenhouse gases. EVs are not just about the future of our planet, but very much about addressing preventable deaths today. While air-quality is often categorized as a problem in developing countries, Nitrogen oxide (NO ) and other x PM2.5 particulates* cause significant issues in developed countries as well. In Europe alone, almost 800,000 people die prematurely every year due to pollution-related illnesses. EVs not only reduce the world's total carbon footprint, but also help to reduce city pollution. Fine Particulate Air Pollution in Europe (2022) 70
Tesla Semi Semi offers an opportunity to have an outsized impact on GHG emissions from transport Reducing Fleetwide Emissions Combination trucks –of which the vast majority are semi trucks – in the U.S. account for just 1.1% of the total fleet of vehicles on the road. That said, because combination trucks have high fuel consumption due to their weight and heavy utilization, they account for approximately 18% of all U.S. vehicle emissions. Electrifying the heavy-duty truck segment is an essential part of transitioning the world to sustainable energy. Payload equal to a diesel truck With both the U.S. and E.U. having approved higher weight allowances for electric heavy-duty trucks, we expect the payload to be at least as high as it would be for a diesel truck. In the E.U., electric semi trucks are allowed to be 2 tons (~4,400 pounds) heavier than diesel equivalents, and in the U.S. the allowance is 0.9 tons (2,000 pounds). When fully loaded, the Tesla Semi should be able to achieve over 500 miles of range, achieved through aerodynamics and highly efficient motors. This truck will be able to reach an efficiency of over 0.5 miles per kWh. Tesla Semi is critical to our mission to accelerate the world’s While most heavy trucking journeys are shorter than 500 miles, we want long-distance hauling to also be transition to sustainable energy. Right now, cell availability is sustainable. We are in the process of developing a Semi charger network at trucking rest stops across the U.S. the limiting factor for production – a Tesla Semi requires and Europe, where each Tesla Semi could top up their range. multiple times more cells than a passenger vehicle. % of U.S. Vehicle Fleet % of U.S. Vehicle Emissions 1.1% 17.9% 98.9% 82.1% 71 Combination Trucks Rest of Fleet Combination Trucks Rest of Fleet
Waste Generated Per Vehicle Manufactured As we build more efficient factories, our waste per vehicle decreases Building localized factories both makes sense economically and reduces waste. First, because the automotive supply chain doesn’t have a strong presence on the West Coast of the U.S., many components need to be shipped from long distances, requiring excessive packaging and creating more waste than necessary. Second, modern factories are better designed for material flow. Trailer entry points surround the whole factory, which means that components can be offloaded precisely at the part of the factory where they are needed. Less material flow results in less waste, because a shorter journey requires less protective packaging. The chart below shows that waste generation per vehicle at Gigafactory Shanghai is less than half of what it is in the U.S. We are expecting our upcoming factories such as Gigafactory Berlin-Brandenburg and Gigafactory Texas to continue the same trend. Any materials that are possible to recycle, we recycle The vast majority of generated waste, such as paper, plastics and metals, is recyclable. At Gigafactory Shanghai, for example, just 7% of total waste generated in 2021 was not recyclable. We push for innovative approaches to reducing waste, which includes reduction of non-recyclable materials in the first place, learning from local factories and deploying improvements globally or working with our logistics team to minimize shipments and packaging per vehicle. Waste Generated in Vehicle Manufacturing (2021; kg/vehicle) 600 400 200 0 Global Vehicle Manufacturing Legacy Manufacturing Sites New Manufacturing Sites Waste Diverted from Disposal (Recycled) Waste Directed to Disposal • Global Vehicle Manufacturing = all major factories dedicated to vehicle manufacturing, including the Fremont Factory and supporting facilities, Gigafactory Nevada and 72 Gigafactory Shanghai. • Legacy Manufacturing Sites = Gigafactory Nevada, Fremont Factory and supporting facilities. • New Manufacturing Sites = Gigafactory Shanghai.
Water Used Per Vehicle Manufactured We currently use less water per vehicle than almost any ICE carmaker Current State There is a misconception that producing an EV requires more water than producing an ICE vehicle. Our data shows this is not the case. While each automaker may draw their boundaries slightly differently (depending on how vertically integrated they are), according to the latest publicly available figures, Tesla withdrew less water at facilities dedicated to vehicle manufacturing per vehicle produced than the majority of established carmakers. Furthermore, the efficient manufacturing design we are implementing at our new factories in Texas and Berlin-Brandenburg will result in further reductions in our water usage per vehicle. Our goal is to have industry-leading low water usage per vehicle, even when accounting for cell manufacturing. The below chart includes our latest estimates for water usage per vehicle at those facilities. Water usage and power generation While many recognize the impact that power generation has on GHG emissions, its impact on water consumption is less appreciated. Power generation is one of the leading causes of water withdrawal in the U.S., as water for thermoelectric power is used to generate electricity with steam-driven turbine generators and to cool power-producing equipment. This means that every kilowatt-hour (kWh) of clean solar energy produced not only lowers GHG emissions, but also lowers water consumption. 3 Water Withdrawal Intensity in Vehicle Manufacturing (m /vehicle) 5 4 3 2 1 0 GF Berlin BMW GF Texas Tesla Ford Industry Toyota VW Group GM Daimler Stellantis (est.)* (est.)* (2021) Avg. (cars) Vehicle Manufacturing Cell Manufacturing 73 *Latest estimate for water consumption based on factory design. Actual production figures will not be known until factories are ramped to full production speed.
Water Used Per Vehicle Manufactured Tesla factories are setting a new standard of water use per vehicle Initiatives at Our Factories Water is becoming increasingly scarce as the climate changes. That is why we are reducing our water usage throughout our operations as much as possible. We have prioritized direct use in manufacturing and will continue to explore the rest of our impact throughout the supply chain and in sales, service and delivery. The “cooling tower makeup” is the single biggest contributor to water usage in any car factory after paint operations. As water that cools machinery evaporates, it needs to be topped up regularly. The total cooling tower makeup could be offset entirely by non-potable sources such as rainwater or wastewater. These are some of the initiatives we are taking at Gigafactory Berlin-Brandenburg and/or Gigafactory Texas in order to reduce water consumption per complete vehicle (including cells). 1. Water intensive process optimization: We are constantly looking into reducing water consumption by optimizing or eliminating water intensive production processes across our operations. At Gigafactory Berlin- Brandenburg, we use hybrid cooling towers, have eliminated quench tanks in casting and introduced cascade rinsing systems in the paint shop and battery can wash process for cell manufacturing. 2. Rainwater and condensate harvesting and reuse: We are planning to capture at least 25% of roof runoff (1 million square feet) to a central underground storage system within Gigafactory Texas. Rainwater will be recycled for use in the cooling of manufacturing equipment. In an average year, such systems should save an estimated 7.5 million gallons of potable city water. Additionally, as hot, humid outdoor air is conditioned, water condenses out of the air. Typically, this condensate is discarded as wastewater. At Gigafactory Texas, we reuse this condensate in our cooling towers and process water systems to offset incoming site water. 3. Reclaimed and recycled water (wastewater reuse): Using local treated wastewater could result in offsetting the entire annual cooling tower makeup water demand with non-drinkable uses. At Gigafactory Texas, this could result in an estimated 40 million gallons of potable city water conserved annually. Reclaimed water is available and under investigation for use at both Gigafactory Texas and Gigafactory Berlin-Brandenburg. 74
Emissions Credits Emissions credit systems around the world are designed to economically benefit companies with non-polluting Accelerating Deployment of New Factories products by allowing them to sell their credits to polluting companies. In order to meet various countries’ emission targets and avoid government fines, polluting companies pay non-polluting companies through credit purchases. The goal of this system is for every OEM to be incentivized to reduce emissions and themselves become non-polluting by selling more of their own manufactured EVs instead of paying another company for their non-polluting credits. Emissions credit revenue is used for EV capacity expansion, which in turn displaces ICEs In 2021, we generated almost $1.5 billion in revenue selling zero-emission regulatory credits to other OEMs. Proceeds from such sales will go towards building new factories to produce EVs that will continue to displace ICE vehicles. While it is common practice today for ICE vehicle OEMs to purchase regulatory credits from other companies (such as Tesla) to offset their total GHG emissions, it is not a sustainable strategy. In order to meet increasingly strict regulatory requirements across the world, OEMs will be forced to develop truly competitive EVs. EV sales by all carmakers need to accelerate, taking market share from ICEs In 2021, Tesla delivered almost 1 million EVs globally. We hope that every car manufacturer will strive to produce hundreds of thousands of EVs per year, as significant reduction of emissions will only be achieved if all carmakers push for an industry-wide shift to EVs. Electric Vehicles Produced 1,000,000 2017 2018 800,000 2019 600,000 2020 2021 400,000 200,000 0 Tesla VW BYD Hyundai R-N-M Stellantis BMW Daimler Ford GM Toyota Jaguar Group Motor Alliance Group Motor Land Corp. Rover (Tata) 75 Source: EV-volumes.com; Micro-cars not included. Tesla data are production volumes; other OEMs sales and delivery volumes are assumed to approximate their production for the year.
Product Impact 76
Vehicle Affordability What Do We See As Impact? Price Equivalency Between EVs and ICE Vehicles Consumers are unlikely to buy products only because they have a low lifetime carbon footprint. In order to convince consumers to buy our products, they need to be better in every way – performance, cost of ownership, safety, fun and more. We want to make products that people love. Model 3 is the first EV to be priced on-par with ICE vehicle equivalents Model 3 is the first EV in history priced competitively with its gas-powered equivalents, even before taking into consideration any regional subsidies and lower running costs. Unfortunately, most other EVs on the market today are often priced at over a $10,000 premium compared to their direct ICE vehicle equivalents. There doesn’t need to be a tradeoff between sustainability, performance and affordability Tesla’s ability to achieve our mission rests first and foremost on our products. We are not just trying to build the best electric cars, we are striving to build the best cars, period. Our focus from the beginning has been to develop products that are not only sustainable, but also superior to fossil-fuel alternatives in every way. Many incorrectly believe that choosing sustainable products requires consumers to compromise on price or performance, but Tesla vehicles combine performance, safety, efficiency and competitive prices. Similarly, Tesla’s energy generation and storage products power both urban and remote communities with reliable, affordable energy. Starting Price of Mid-Sized Premium Sedans (before subsidies or dealer incentives) $50,000 $40,000 $30,000 $20,000 $10,000 $0 Audi A4 BMW 3 Series Mercedes C-Class* Model 3 RWD Source: OEM websites; pricing as of March 2022. *As reported by CarandDriver.com; Daimler has not yet disclosed pricing for 2022 C-Class. 77
Vehicle Affordability Over 5 years of average driving, the ownership costs of a Tesla Model 3 are closer to a Camry than a 3 Series Total Cost of Ownership The accessibility of our products is fundamental to our mission. While the “sticker price” of Model 3 is similar to an equivalent BMW or Audi, the sticker price of a vehicle itself is only one of many cost items that need to be considered. The lifetime running costs of EVs are lower than those of ICE vehicles due to lower maintenance costs, cheap electricity and high residual value of used Tesla vehicles, the latter of which has remained exceptionally strong since our initial launch. As a result, Tesla Model 3 has a base price similar to BMW 3 Series, but the total cost of ownership per mile is closer to America’s best-selling sedan, the Toyota Camry*. Cost data is based on data collected from our fleet The advantage of having a fleet of vehicles that is constantly online is the ability to analyze real-world data rather than only being able to use estimates. We have an extensive database of Model 3 residual values and cost of repairs, maintenance, energy use, etc. Additionally, the insurance cost for the Model 3 RWD below is based on the projected median insurance rate in the U.S. for Tesla Model 3 drivers. Our analysis shows that over five years and 60,000 miles, running a Model 3 RWD costs 63 cents per mile. Notably, running costs such as fuel (electricity or gasoline), maintenance, tires and repairs for Model 3 should cost just over half of a mass-market ICE vehicle such as a Toyota Camry. Total Cost of Ownership ($ per mile) - 5 years, 60,000 miles Model 3 RWD Toyota Camry BMW 3 Series $0.00 $0.30 $0.60 $0.90 Depreciation, Taxes, Fees, Incentives & Financing Insurance Maintenance, Tires & Repairs Fuel (Electricity or Gasoline) 78 *Based on model year2021 vehicles. Please see page 137 for sources.
Vehicle Usage Customers are using their Tesla as their main car EVs as the Primary Vehicle For an EV to have an impact on the environment, it must be genuinely displacing internal combustion engine miles, rather than sitting in the driveway as a secondary car used for errands or short trips only. Our data shows that Tesla vehicles are being driven more than average vehicles in the U.S., suggesting that they are generally being used as a customer’s primary vehicle. We fundamentally believe that you shouldn’t have to choose between price, quality, usability and sustainability. An EV should be the best vehicle in every way, so consumers don’t ever need to use ICE vehicles. The longer the range, the higher the usage There is a clear relationship between range, how often an EV is utilized and whether it is a primary-use vehicle. The more confident owners are that their EV can be used for commuting, errands and long road trips, the less they will feel they need to supplement their EV with an ICE vehicle. Surveys consistently indicate that the real or perceived lack of EV range is the key reason why many people do not consider replacing their ICE vehicle with an EV. Average Annual Miles Driven in the U.S. Model Y Avg. Vehicle 0 2,000 4,000 6,000 8,000 10,000 12,000 79
Vehicle Usage Freedom of travel is the reason people buy vehicles in the first place. To ensure we replace as many ICE vehicles Long-Distance Travel with EVs as possible, we have been focused on increasing the range of Tesla vehicles. While most personal vehicle journeys are relatively short, and thus drivable on a single charge, consumers do not buy cars that can meet most of their driving needs; they buy a car that meets all their driving needs. The longer the range, the lower the Supercharger use Since its introduction in 2012, we have increased the range of the Model S by over 50%: from 265 miles to 405 miles of range for the long-range version. Our focus on energy efficiency — achieving superior range from the same size battery — has allowed to us continue to increase range while keeping the battery size relatively stable. Our data shows that the longer the range of our vehicles, the less Supercharging Tesla customers do. After all, day trips of over 400 miles are quite rare. Super-fast charging: V3 Superchargers can increase range by up to 200 miles in just 15 minutes Around 300 miles of range at highway speeds is equal to roughly four hours of driving. At that stage, drivers are often likely to take a break. We want to make sure that such a break can be relatively short before continuing the journey. Our latest generation of Superchargers can recover up to 200 miles of range in just 15 minutes of charging, long enough for a quick break and snack. Substantial coverage and 99.96% reliability We’re aware that the chart showing Supercharger uptime looks silly, but that’s kind of the point. While coverage is important, uptime is essential. Few things are as frustrating as arriving to a charging station with a near- empty battery, realizing that none of the charging plugs are working. In 2021 alone, we opened 912 new Supercharger locations around the world for a total of nearly 3,500 charging locations with over 31,000 plugs. Uptime of Supercharger Sites1 100.0% 99.5% 99.0% 2018 2019 2020 2021 80 1 Uptime ofSupercharger sites reflects the averagepercentageof sites globallythat had atleast 50% dailycapacityfunctional for the year.
Vehicle Safety Safety Is Our Top Design Priority Introduction At Tesla, safety features are not optional. Our full suite of safety features comes standard with every vehicle. When we design vehicles, first and foremost, we want them to be safe. This section of the Impact Report will detail our key efforts on the Vehicle Safety front. IIHS Small Overlap Frontal Test – The Most Challenging Rating Test Applies to both Model 3 and Model Y 81
Vehicle Safety Safety ScoreBeta – Incentivizing customers to drive safely Driver Behavior In addition to designing and building cars with the highest levels of real-world safety, we've also been working on ways to help our customers drive as safely as possible. Through our Tesla Insurance program, we do just this by providing real time feedback to customers and incentives for safe driving such as reductions in monthly insurance premiums. Customers who choose to be a part of this program receive a Safety ScoreBeta. This score changes based on driving behavior and the insurance premium changes with it. Instead of determining a driver’s insurance premiums from demographic information (gender, age, education, or marital status) and financial history (credit score), our algorithm calculates Safety ScoreBeta based on actual driver behavior. The behaviors we monitor are: • Forward Collision Warnings • Hard Braking • Aggressive Turning • Unsafe Following (Tailgating) • Forced Autopilot Disengagement Our data show a lower rate of collision for the cohort of customers who have enabled Safety ScoreBeta. As the vehicle’s Safety ScoreBeta increases, the number of collisions per mile decreases and insurance premiums reduce. Collision rate per million miles ranked by Safety ScoreBeta 91 - 100 Score 81 - 90 Score 71 - 80 Score 61 - 70 Score 0 - 60 Score 82 0
Vehicle Safety Our commitment to safety is why all Tesla vehicles built since October 2016 come with a suite of external Crash Avoidance cameras, additional sensors and onboard computing that enable advanced safety features like Automatic Emergency Braking, Lane Departure Warning, Forward and Side Collision Warning, Obstacle-Aware Acceleration, blind spot warnings and more — all of which continue to improve over time through software updates. We recently introduced active safety features that go beyond the norm: Traffic Light & Stop Sign Warning When a driver doesn’t notice a red light or a stop sign, our cars will notice that vehicle’s speed is too high. Thanks to our eight-camera system, each vehicle can recognize a traffic light that is specific to vehicle’s trajectory as well as a stop sign. A loud warning is triggered to alert the driver. Pedal Misapplication Mitigation (accelerator pressed inadvertently) Pressing the accelerator pedal when the circumstances indicate you should be pressing the brake instead, like when pulling into a parking space, is relatively common no matter what vehicle you're in. However, if you are in a Tesla, when our cameras recognize an object in front of the car, “Pedal Misapplication Mitigation” system cuts torque from the electric motor to prevent a collision if you happen to press hard on the accelerator. This technology has prevented or mitigated hundreds of collisions every month. Active avoidance of lane departure or a blind-spot collision If a driver is changing into a lane while a vehicle in the blind spot is entering the same lane, or if our vehicle starts departing its lane without an indicator, our vehicles will sound a warning and assist the steering to avoid a collision. 83
Vehicle Safety Not all Active Safety systems are created equal Safety Assist Ratings Many people assume that AEB (Automatic Emergency Breaking) –a system that most new vehicles are equipped with – works equally well with all vehicles. That’s not the case. The range of sensors, compute power and quality of software in the system can vary dramatically. Our active safety features are powered by eight cameras, a neural-net computer and learnings from our fleet of over two million cars. After the introduction of Tesla Vision (a vision-only system that excludes radar), our active safety ratings with IIHS improved. Pedestrian AEB performance of our Tesla Vision was over 45% better than performance of vision + radar. It is no surprise that the active safety score achieved by Tesla Model 3 Euro NCAP remains an outlier. Model X Model 3 Model Y Euro NCAP* 94% 94% Scheduled for 2022 ANCAP* (Australasian New Car Assessment Program) 94% 94% Scheduled for 2022 IIHS (Insurance Institute for Highway Safety) Superior Superior Euro NCAP Safety Assist Rating (2019) 100% 95% 90% 85% 80% 75% 70% Tesla Citroen VW Audi SEAT Skoda Mercedes Subaru VW Lexus Model 3 C5 T-Cross A1 Tarraco Octavia GLE Forester Golf UX *2019 Safety Assist ratings 84
Vehicle Safety Tesla vehicles are engineered for safety and when Autopilot is engaged safety is enhanced Autopilot Safety In 2021, we recorded 0.22 crashes for every million miles driven in which drivers were using Autopilot technology (Autosteer and active safety features). For drivers who were not using Autopilot technology (no Autosteer and active safety features), we recorded 0.77 crashes for every million miles driven. By comparison, NHTSA’s most recent data shows that in the United States there are 1.81 automobile crashes for every million miles driven. Numbers of Vehicular Accidents per Million Miles Driven (2021) 2.0 1.5 1.0 0.5 0.0 Tesla Vehicles Tesla Vehicles Total U.S. Autopilot Engaged No Active Safety Vehicle Fleet* For the latest quarterly accident data related to our vehicles and a description of our methodology used to collect accident data, please view our Vehicle Safety Report. 85 *Based on NHTSA’s most recent crash data.
Vehicle Safety Tesla strives to go beyond industry standard testing by using real-world data from our fleet of over two millions Data-Driven Pre-Crash Safety cars on the road. Historically, the aim of manufacturers has been to design their vehicles to perform well for a suite of regulatory and consumer tests. There are too many common impact scenarios (visible in the heatmap below) that are simply not covered by regulatory crash tests. The richness of data we are collecting enables us to develop safety in all scenarios, not only the ones covered by regulation and ratings. Algorithm, Trained By Fleet, Triggers Optimal Safety Responses We analyze data from our fleet to find solutions, which we then update via over-the-air software updates. Our algorithm uses vehicle sensor data and, within tens of milli-seconds of impact, determines what type of impact has occurred and triggers the seatbelt pretensioners and airbags to respond in the most optimal way down to the millimeter and mile per hour. Tesla engineers are also in the final stages of evaluating a system which uses Autopilot to identify when a crash is imminent. This gives Tesla vehicles an uncanny ability to predict potential collisions and respond faster to an impact when it does occur. Real World Tesla Crash Data r a e eed r p m o r e sf v i e t a ng 80 kmh rear impact (FMVSS305) ela R h c Side 0 MDB nt o 20 mph 30°Angular r eed f 25 mph 30°Angular p m 40 mph Small Overlap o e sr v f i t e 40 mph ODB a ng ela 35 mph R h Flat c Collisions Recorded By Our Fleet Frontal Regulatory Collision Test Relative speed change (impact) from right 0 Relative speed change (impact) from left 86
Vehicle Safety Changing How Vehicles Are Designed For Safety Data-Driven Safety We use field data, data analytics and simulations to inform our design and safety engineers’ work on future products and to send software improvements to our existing fleet via over-the-air updates. Tesla is also sharing data and statistics collected by our vehicles with select regulatory bodies and external research organizations — in an anonymized fashion or with consent and in accordance with local data privacy laws —giving them access to an unprecedented opportunity to understand crashes in the real world. This access to data will accelerate impact safety research, driving change across the safety industry and improved safety outcomes for all vehicles to protect lives. Post-Crash Data Analysis After we send new software to the fleet, we wait for new data to come through to understand the efficacy of the system once it is deployed in the real world. Since deployment of our ‘offzone’ side algorithm (data-driven safety), we learned that of the total vehicles that had their airbags deployed, 15% of those deployed due to our new algorithm in these new modes. This confirms our expectations and highlights how effective fleet-based learnings and rapid deployment of novel solutions can be. Why Airbags Sometimes Don’t Deploy In a fairly common “small overlap” collision as the one shown below, front sensors are unlikely to pick up a side collision, as they are usually designed to detect a frontal collision. And side sensors are usually too close to a driver window to detect a collision far in the front. We designed our sensors and their positions in a way that Watch video on Data-Driven Safety they can pick up nearly every type of collision and deploy airbags if necessary. Restraints Deployments Since Introducing Data-Driven Algorithm Regular restraint deployment Restraints deployment not covered by regulation 87
Vehicle Safety Safety starts with our clean sheet design Passive Safety/Collision Improving occupant safety has always been key to our mission. All our vehicles are built off a safety-first architecture with a low center of gravity (thanks to the positioning of our battery) and enhanced frontal impact safety (thanks to the front trunk that is void of the engine found in forward engine ICE vehicles). Added benefit of enhanced performance Based on the advanced architecture of Model S and Model X, we engineered Model 3 and Model Y to be some of the safest cars built to date, anywhere. Even though Model 3 and Model Y have no engine, their performance is similar to a “mid-engine internal combustion car” due to a centered battery pack and the fact that the rear motor is placed slightly in front of the rear axle rather than behind it. Not only does this architecture add to the overall agility and handling of the car, but it also improves stability control effectiveness by minimizing rotational kinetic energy. Model 3 and Model Y score 5-stars in all USNCAP categories After putting Model 3 and Model Y through a series of crash tests used as part of the New Car Assessment Program to calculate the likelihood of serious bodily injury for front, side and rollover crashes, the National Highway Traffic Safety Administration (NHTSA) awarded each top safety ratings of 5-stars in every category and subcategory. Over-the-Air Updates Tesla has pioneered the state-of-the-art way of improving a vehicle’s safety over time A hallmark of Tesla ownership is connectivity. We are an industry leader in deploying over-the-air (OTA) software updates to our vehicles. These updates are integral to – and continuously enhance – the customer experience, and they can include improvements to customer safety or a remedy to a recall. OTA updates can be installed at a customer’s convenience without a trip to a Tesla Service Center. 88
Vehicle Safety Safety Awards Since 2019, Tesla vehicles earned 5-star ratings from safety rating agencies across the U.S., Europe and Australia. Furthermore, all of Tesla’s safety features come standard with every vehicle and our ratings are based on our standard safety equipment. At Tesla, we do not believe that safety should be optional. Top rating for Model 3 occupant safety and active safety Top rating for Model Y Scheduled for Scheduled for occupant safety, 2022 2022 pedestrian safety and active safety 89
Vehicle Safety Fire incidents are ~11x lower for Tesla vehicles than the average vehicle in the U.S. Fire Risk When the media reports a story about a vehicle fire, it is usually reporting on an EV fire. This is likely a result of chasing clicks, rather than the prevalence of EV-related fires compared to ICE vehicle-related fires. The reality is, when compared to Tesla vehicles, ICE vehicles catch fire at a vastly higher rate. According to the latest available data, in 2020, there were almost 173,000 vehicle fires in the U.S. alone. From 2012 to 2021, there has been approximately five Tesla vehicle fires for every billion miles traveled. By comparison, data from the National Fire Protection Association (NFPA) and U.S. Department of Transportation show that in the U.S. there are 53 vehicle fires for every billion miles travelled. In order to provide an apt comparison to NFPA data, Tesla’s data set includes instances of vehicle fires caused by structure fires, arson and other reasons unrelated to the vehicle, which account for some of the Tesla vehicle fires over this time period. We continue to improve safety We continue to improve our battery chemistry, cell structure, battery pack structure and vehicle passive safety in order to decrease fire risk to as close to zero as possible. As Tesla’s vehicle technology continues to improve, fires will be even less likely for our EVs. Tesla has partnered with European and Australasian NCAPs to provide free mobile app-based emergency response documentation for quick access to Tesla vehicle specific models. We make detailed information available to first responders so they can safely handle those emergency situations. Number of Fire Events per Billion Miles Travelled (2012-2021) U.S. Avg Tesla 0 10 20 30 40 50 90 For the latest fire data related to our vehicles, please view our Vehicle Safety Report.
Solar + Storage Product Commercial scale customers: Megapack and renewables Matching Energy Demand & Supply The beauty of selling commercial storage systems such as Megapack is that purchasing such a product is almost purely a mathematical decision for our commercial customers. If installing Megapack makes economic sense, there is no reason not to install one. A single Megapack has on average 3,000 kWh worth of battery storage capacity, and given its scalability, enables projects over 1,000,000 kWh. Tesla Energy continues to be dependent on the global supply chain, including cell supply. In 2021, in order to meet demand that is well in excess of supply for energy storage products, Tesla began building a new production facility capable of producing 40,000,000 kWh of energy storage per year. Energy Storage Enables 100% Renewables Penetration 120 100 80 GW60 40 20 0 Monday Tuesday Wednesday Thursday Friday Saturday Sunday 91
Solar + Storage Product Pairing energy storage with renewables enables cost-effective decarbonization of the grid Potential For Growth The best way to avoid blackouts is to reduce your reliance on the grid. Tesla is a one-stop shop for taking our customers off-grid by covering a large variety of their needs. In 2021, Tesla sold 4 GWh worth of energy storage products, more than 15% of the 25 GWh global market*. Some of these projects were massive deployments, including a 371 MWh installation in California and a 497 MWh installation in Victoria, Australia. In order to switch global energy usage to renewable sources, we estimate that global annual battery storage production will need to increase to ~10,000 GWh. Residential customers: Solar Roof, solar panels and Powerwall Anyone can dramatically reduce their carbon footprint by installing Solar Roof or solar panels with Powerwall. In theory, all U.S. domestic electricity needs, as well as vehicle transportation needs, could be met by sunlight alone. Naturally, installation of such a system needs to make financial sense for the customer. In Massachusetts, for example, we estimate that an average solar and storage system pays for itself with energy cost savings within approximately 10 years. As the cost of these products continues to decline, more customers will be willing to switch to solar and storage purely due to lower overall cost. Tesla Energy Storage Deployments (GWh) 4.0 3.5 3.0 2.5 2.0 1.5 1.0 0.5 0.0 2015 2016 2017 2018 2019 2020 2021 *Source: S&P Global 92
Solar + Storage Product Grid outages are becoming more common Improving Resilience Of The Grid Electrical disturbances in the U.S. are becoming more common, predominantly due to weather and natural disasters. According to the U.S. Department of Energy, electrical disturbances cost businesses $150 billion per year. It is not surprising that homeowners and businesses are increasingly turning to backup power supply options. Our solar and energy storage products are a great way to reduce emissions while also ensuring backup power during outages. Low cost is key to mass adoption We are continuously working on reducing the cost of our products in order to foster mass adoption. Ultimately, using renewable energy (such as solar or wind) with battery storage will become the cheapest energy option available, regardless of location. This is already the case in many, but not all, locations around the world. As the cost continues to decline, more customers will be able to financially benefit from turning to renewable energy. Reported Electrical Disturbances in the U.S. 600 500 400 300 200 100 0 2004 2005 2006 2007 2008 2009 2010 2011 2012 2013 2014 2015 2016 2017 2018 2019 2020 2021* Weather or natural disaster Vandalism, attack, or sabotage Other Source: U.S. Department Of Energy, Pew Charitable Trusts 1 Includes cases of suspicious activity. 2 Other includes all disturbances that are not clearly identified as weather, natural disaster, vandalism, attack or sabotage. 93 *Full year figure is a Tesla estimate calculated using data from the first six months of 2021 extrapolated based on historical trends.
Supply Chain 94
Supply Chain What do we see as impact? Introduction Protecting human rights and the environment is core to our procurement strategy. Tesla creates our products from many different materials and components, some of which we purchase from our direct (Tier 1) suppliers. Many of our Tier 1 suppliers do not purchase all their raw materials directly, rather they get them from their suppliers and sub-suppliers around the world through a complex supply chain. Though we believe that battery recycling will play a critical role in supplying a portion of these materials to enable a closed loop supply chain, we recognize that global battery cell production will continue to rely heavily on primary, mined materials to meet the growing demand for our products. In line with our mission to accelerate the world’s transition to sustainable energy, Tesla is committed to ensuring that companies in our supply chain respect human rights and protect the environment. Our goal is that where Tesla’s supply chain touches, local conditions for stakeholders continuously improve as a result of our purchases. Our responsible sourcing strategy has the following objectives: 1. Increase the share of materials we source directly from suppliers, and those closer to our factories (supply chain localization); and 2. Continue to source globally, to contribute to the improvement of local conditions in our sourcing communities. Mapping GHG emissions in the battery supply chain is one of our top priorities Upstream GHG emissions from manufacturing an EV battery – from raw material extraction through refining and transportation of materials – can be meaningful. We estimate that these specific activities cause up to ~80% of the total emissions of a Model 3 battery pack, with the largest contributors at the chemical processing stage. Our battery supply chain GHG emissions hotspot analysis – an industry first – is on page 104 of this report. ~12 ton of rock mined Refined electrode material Produce a battery pack Produce a battery pack Produce a battery pack Refine Recycle Recycle Recycle 95
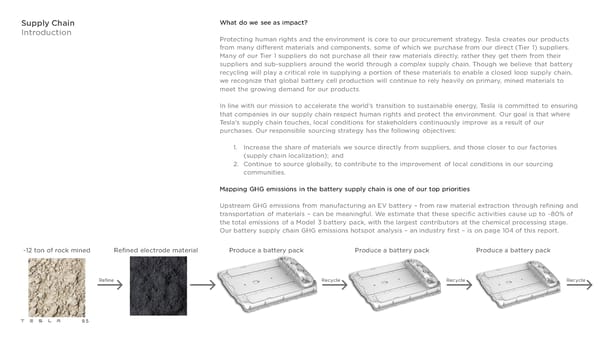
Supply Chain A common question we receive is: “What happens to Tesla battery packs once they reach the end of their life?” Recycling An important distinction between fossil fuels and lithium-ion batteries as an energy source is that while fossil fuels are extracted and used once, the materials in a lithium-ion battery are recyclable. When petroleum is pumped out of the ground, chemically refined and then burned, it releases toxic emissions into the atmosphere that are not recoverable for reuse. Battery materials, in contrast, are refined and put into a cell and will remain in the cell at the end of their life when they can be recycled to recover valuable materials for reuse, repeatedly. Longer battery longevity is the most sustainable option Battery pack life extension is the superior option to recycling for both environmental and business reasons. Before decommissioning and recycling a consumer battery pack, Tesla does everything it can to extend the useful life of each pack, including sending out over-the-air software updates to Tesla vehicles to improve battery efficiency when our engineers find new ways to do so. In addition, any battery that is no longer meeting a customer’s needs can be serviced at a Tesla Service Center. Every battery used in R&D or returned from the field that cannot be re-manufactured is recycled Tesla batteries, including the battery packs in our vehicles and our energy storage products, are made to last many years, and therefore, we have received a limited number of them back from the field. Most batteries that Tesla recycles today are pre-consumer, coming to us through R&D and quality control. None of our scrapped Extracting raw lithium-ion batteries go to landfills and 100% are recycled. Furthermore, Tesla has an established internal materials ecosystem to re-manufacture batteries coming from the field to our Service Centers. We actively implement circular economy principles and consider all other options before opting for battery recycling. The small number of post-consumer batteries that we receive are primarily generated from our fleet of vehicles on the road, predominantly from taxi-like vehicles. Since we have only been producing Model S (our oldest model) for approximately ten years, and our energy storage products for even less time, it will likely be some time before we start receiving back vehicle batteries in larger volumes. 96
Supply Chain While Tesla works with third-party recyclers, we also recycle in-house Recycling Global annual amount of lithium-ion battery metals sent for In 2020, Tesla successfully installed the first phase of our cell recycling facility at Gigafactory Nevada for in- recycling house processing of both battery manufacturing scrap and end-of-life batteries. While Tesla has worked for years with third-party battery recyclers to ensure our batteries do not end up in a landfill, we understand the 1,500 importance of also building recycling capacity in-house to supplement these relationships. On-site recycling Tons of Nickel brings us one step closer to closing the loop on materials generation, allowing for raw material transfer straight to our nickel and cobalt suppliers. The facility unlocks the cycle of innovation for battery recycling at scale, 300 allowing Tesla to rapidly improve current designs through operational learnings and to perform process testing Tons of Copper of R&D products. By the end of 2021, this facility achieved a production rate of over 50 tons of recycled material 200 per week. Tons of Cobalt Every Tesla battery factory will recycle batteries on-site As the manufacturer of our in-house cell program, we are best positioned to recycle our products efficiently to A closed-loop battery recycling process presents a maximize key battery material recovery. With the implementation of in-house cell manufacturing at Gigafactory compelling solution to move energy supply away from the Berlin-Brandenburg and Gigafactory Texas, we expect substantial increases in manufacturing scrap globally. We fossil-fuel based practice of take, make and burn, to a more intend to tailor recycling solutions to each location and thereby re-introduce valuable materials back into our circular model of recycling end-of-life batteries for reuse over and over again. manufacturing process. Our goal is to develop a safe recycling process with high recovery rates, low costs and low environmental impact. From an economic perspective, we expect to recognize significant savings over the long term as the costs associated with large-scale battery material recovery and recycling will be far lower than purchasing additional raw materials for cell manufacturing. 97
Supply Chain We have high expectations for our suppliers Alignment with Best Practices Tesla is committed to ensuring that our suppliers operate responsibly. We do this by proactively identifying and addressing potential risks in our supply chains. The Tesla Supplier Code of Conduct, Human Rights Policy and Responsible Materials Policy outline Tesla’s expectations for suppliers. We established a responsible sourcing program based on international best practices Our responsible sourcing program is based on the OECD Due Diligence Guidance for Responsible Mineral Supply Chains. Tesla collects data from its supply chain (including through audits), translates this data into on- the-ground actions and discloses the outcomes in our annual Impact Report. Direct Sourcing from Upstream Companies Establish Due Diligence Management System Collect and Disclosure in the investigate Supply Impact Report Chain Environmental and Social Data Collaboration with Risk Mitigation Industry Initiatives and Improvement of Conditions Positive Local Impact The next sections will detail how we undertake each of the five steps laid out above, starting with our management system approach. 98
Battery Supply Chain Prioritization of cobalt, lithium and nickel #1 The Tesla Approach Given their unique significance to the success of EVs and energy storage, Tesla has a dedicated responsible sourcing program for three priority minerals in the battery supply chain: cobalt, nickel and lithium. We prioritize these raw materials for the following reasons: 1. Commercial importance: Cobalt, lithium and nickel are the key raw materials used in cathode production, represent about a third of the total costs of a battery cell and play an essential function in improving vehicle range and safety performance. 2. Potential environmental and social impact and scrutiny: Cobalt, lithium and nickel are also ‘minerals’ – in that they are raw materials that are produced through different methods of mining around the world, often concentrated in countries that face socio-economic and environmental challenges. As known global reserves are depleted, these minerals are becoming increasingly scarce, and companies look to access resources in more remote and challenging locations to meet global demand. Cobalt, lithium and nickel are also classified as critical minerals by the United States, European Union and Canadian governments because they are essential in enabling a transition away from fossil fuels to a low-carbon economy. As a result, the impact of mining activity on the environment and local communities lends itself to greater environmental and social scrutiny from civil society, policymakers and investors. Mining has an important role to play in the transition to sustainable energy and we engage with suppliers to ensure mining is done in a responsible way. This is one of the reasons Tesla joined the Initiative for Responsible Mining Assurance (IRMA) and uses the IRMA Standard as well as other internationally recognized responsible mining standards in our due diligence. 99
Battery Supply Chain The unique Tesla approach: Going directly to the source #1 The Tesla Approach The implementation of an OECD-aligned approach for cobalt, nickel and lithium is underpinned by the following two pillars: 1. Direct sourcing from mining companies: While cobalt, nickel and lithium go through multiple processing steps by different companies, some of the more important environmental and social risks in this supply chain are present at mine sites. Direct sourcing from mining companies allows Tesla to engage directly in local contexts instead of having to rely on multiple midstream companies that typically sit between EV makers >95% and mining. It also enables more transparent and traceable supply chains and better environmental and Lithium hydroxide sourced directly social data. In 2021, Tesla procured >95% of lithium hydroxide, >50% of cobalt and >30% of nickel for nickel- containing (NCA and NCM) cells directly from nine mining and chemicals companies. All nine binding contracts include environmental and social requirements. As Tesla’s battery supply chain continues to scale, . >50% Tesla expects the proportion of directly sourced minerals to increase Cobalt sourced directly 2. Direct local engagement: Building on direct supplier engagement, Tesla seeks to contribute to the continuous improvement of conditions in communities affected by operations in Tesla’s supply chain, informed by engagement with local experts, community organizations and civil society. >30% Nickel sourced directly 100
Battery Supply Chain Our diversified cathode strategy #1 The Tesla Approach Tesla’s batteries today contain a variety of different cathode chemistries, including nickel-cobalt-aluminum (NCA) and nickel-cobalt-manganese (NCM) for higher energy applications and lithium iron phosphate (LFP) for lower energy applications. Tesla will continue to advance a diversified cathode strategy for LFP, nickel-rich and manganese-rich cathodes to address various market segments for vehicle and energy storage products and provide future flexibility based on raw materials availability and pricing. To put this into context, lithium only accounts for roughly 1.5% of the full battery pack weight. Additionally, iron phosphate battery packs contain no cobalt or nickel. While the relative cathode compositions and our overall demand of various minerals and battery-grade chemicals will continue to evolve, Tesla and the global battery supply chain will require significant quantities of responsibly produced lithium, nickel, cobalt, manganese, iron, phosphates and many other minerals for the foreseeable future. While we recognize the critical role battery recycling will play in supplying a portion of these materials to enable a closed loop supply chain, global cell production will continue to rely heavily on primary, mined materials to meet the growing demand in the short to medium term. The availability and affordability of these minerals and chemicals are key to advancing Tesla’s mission and accelerating the transition to sustainable energy. We will continue to collaborate with our suppliers and upstream producers in providing visibility to enable the scale up of key battery minerals. For cells containing NCA and NCM cathodes, we continue to work toward batteries that contain higher levels of nickel in order to improve vehicle range while lowering overall battery costs, without compromising overall cell performance, such as battery safety and lifetime, that is currently enabled by cobalt. It is important to note that we expect our absolute cobalt demand to increase over the coming years because our vehicle and cell production growth rate is forecasted to outpace the overall rate of cobalt reduction on a per cell basis. Nickel-Cobalt-Aluminum Cathode Nickel-Manganese-Cobalt Cathode Lithium-Iron-Phosphate Cathode P 101
Battery Supply Chain Collect and review environmental and social data to identify risks #2 Risk Identification In the past year, Tesla collected environmental and social data in its cobalt, lithium and nickel supply chains through the following main activities: 2.1 Audits Audits are an important tool for Tesla to gather environmental and social data for cobalt, nickel and lithium. 100% • In 2021, 83% of refiners and mine sites in Tesla’s supply chain, including 100% of refiners and mine sites from Refiners and mine sites in Tesla’s whom Tesla sources directly, either underwent or committed to undergo independent external sustainability cobalt, nickel and lithium supply audits against one of the following sustainability and responsible mining standards: IRMA Standard, the chains that we directly sourced from Responsible Minerals Initiative (RMI) Responsible Minerals Assurance Process (RMAP), Towards Sustainable underwent or have committed to Mining (TSM) and/or the International Council on Mining and Metals (ICMM) Performance Expectations. undergo independent third-party • In addition, Tesla conducted six audits in the battery supply chain tailored to Tesla’s specific environmental and social requirements, including the OECD guidance and environmental management systems. Tesla also sustainability audits has an audit program that goes beyond the battery supply chain – please see pages 112 - 115. • Tesla also reviews suppliers’ ISO14001 (environmental management) and OHSAS 18001 (occupational health 83% and safety) certification statuses. Of all refiners and mine sites in Tesla’s cobalt, nickel and lithium supply chains underwent, or have committed to undergo, independent third-party sustainability audits 102
Battery Supply Chain 2.2 Continued supply chain mapping #2 Risk Identification Tesla used a newly developed Know-Your-Supplier (KYS) Questionnaire to map our battery supply chain and collect information related to suppliers’ environmental and social management systems. The table below lists all our direct supplier relationships in the battery supply chain. Independent Life-Cycle Supplier Material Country Type External Analysis Sustainability (LCA) 1 2 Assessment Completed Albemarle Lithium Australia (mine); China Integrated Mine Site + Refiner (refinery) Livent Lithium Argentina (mine); Integrated Mine Site + Refiner China, USA (refinery) Ganfeng Lithium China Refiner N/A3 Yahua Lithium China Refiner N/A3 Guizhou CNGR Cobalt, Nickel China Refiner Hunan CNGR Cobalt, Nickel China Refiner Huayou Cobalt, Nickel China Refiner Glencore Kamoto Cobalt Democratic Republic Mine site Copper Company of Congo (DRC) Glencore Murrin Nickel Australia Integrated Mine Site + Refiner Legend Murrin BHP Nickel West Nickel Australia Integrated Mine Site + Refiner Completed Prony Resources Nickel New Caledonia Mine site In progress / planned / Vale Nickel Canada Integrated Mine Site + Refiner commitment made No commitment / undisclosed 1 Independent external sustainability assessments included: Initiative for Responsible Mining Assurance (IRMA), the Responsible Minerals Initiative (RMI) Responsible Minerals Assurance Process (RMAP), and/or the International Council on Mining and Metals (ICMM) Performance Expectations, Towards Sustainable Mining (TSM) 2 This column refers to LCAs conducted by the supplier (not Tesla). 3 rd There is currently no industry-wide 3 party audit program for lithium refiners. 103
Battery Supply Chain 2.3 GHG emissions hotspot identification #2 Risk Identification In addition to the product-specific LCA described in the Environmental Impact section, Tesla also commissioned LCA service provider Minviro to identify hotspots with high global warming potential across eight specific processing routes from which we currently source cobalt, nickel and lithium. The hotspot analysis found that main drivers of GHG emissions depend on the different battery compositions, processing routes and countries of origin. Overall, key drivers are the cathode and anode supply chains. Within the cathode supply chain, the hotspots are nickel and lithium, and cobalt was only a minimal contributor. Within the cobalt, nickel and lithium supply chains, chemical processing (refining / smelting) was a larger driver than mining. CO2e Contribution from Materials and Processes within Nickel-Based Battery Supply Chain 23% 100% 8% 18% 4% 13% 2% 31% 1% Nickel Cobalt Lithium Aluminum Electricity Graphite Other Electricity Total (Cathode) (Cell Assembly) 104 Upstream of Tesla
Battery Supply Chain 2.3 GHG emissions hotspot identification #2 Risk Identification Tesla complemented the hotspot analysis with data collected during a pilot blockchain traceability project for nickel sourced from Tesla nickel supplier, BHP, that traced nickel from a mine site in Australia to Tesla and collected GHG emissions data for every step. The pilot project showed that mining and upstream processing had a higher CO e intensity than precursor, cathode and battery cell production. 2 Building on this hotspot analysis and pilot project, Tesla developed a data collection methodology aligned with the GHG Protocol – a globally recognized standard for measuring GHG emissions – and informed by the European Product Environmental Footprint methodology and the Product Environmental Footprint Category Rules (PEFCR) guidance for batteries — a set of rules developed by the European Union on calculating product- specific environmental footprint. Instead of relying on estimates or aggregate data from third parties, Tesla’s ambition is to collect as much primary data from Tesla’s suppliers as possible to get the most accurate understanding of GHG emissions hotspots and therefore, how to reduce emissions. Approach to Supply Chain Data Collection for GHG emissions 105
Battery Supply Chain 2.4 Reports from non-governmental organizations (NGOs) and local stakeholders #2 Risk Identification Reports and grievances from NGOs and community organizations as well as media articles are other important sources for potential environmental and social risk information. Tesla reviews allegations in detail and conducts its own investigations, including through direct bilateral engagement with relevant suppliers and with the parties making the allegations, to assess the severity of the risk and possibilities for risk avoidance or corrective actions. 2.5 Visits to the Democratic Republic of Congo (DRC) and Argentina A Tesla delegation including members of Tesla’s Responsible Sourcing Committee visited suppliers in the DRC and Argentina. Both trips included visits to mine sites and meetings with community representatives. In the DRC, Tesla also visited a school, an orphanage and a maternity clinic. Aside from contributing to Tesla’s environmental and social risk assessments, the trips helped Tesla better understand local contexts and challenges. The DRC trip provided a more nuanced view of the complex issue of artisanal and small-scale mining (ASM) and its history within the DRC. In Argentina, the trip focused on questions related to water usage and the use of new technologies to extract lithium in a more energy-efficient way. From all the activities listed in this section, Tesla identified six risk areas as well as cross-cutting topics in cobalt, lithium and nickel supply chains for prioritized engagement, described in Step 3, on the next page. Visiting a lithium extraction site in Argentina Visiting a cobalt mine site in the DRC Tesla team visiting a lithium brine operations in Argentina 106
Battery Supply Chain Environmental and social risk mitigation and improvement of conditions #3 Risk Mitigation and Positive Impact As a result of the activities listed in Step 2, Tesla identified the following focus areas for risk mitigation and improvement of local conditions at or around cobalt, nickel and lithium mine sites in Tesla’s supply chain: Priority area Examples of actions taken by Tesla Fair working conditions and Tesla reviewed occupational health and • A supplier’s occupational health and safety system safety • A supplier’s digital system to monitor the risk of unavoidable landslides • Evidence of progress towards the elimination of safety-related incidents • Minutes from community meetings to raise awareness around safety risks related to landslides and trespassing • A supplier’s commitment to conduct a Human Rights Risk and Impact Assessment (HRRIA) Protecting water levels and Tesla reviewed water quality in waterways • Data on water levels and water quality, including environmental surface water monitoring affected by supplier sheets operations • Evidence that potential sources for acid leaks were decommissioned or re-engineered • Minutes from community meetings to raise awareness of potential sources of water pollution and mitigation measures • Written assurance that water is not discharged to water sources for nearby communities Tesla also met with community representatives to confirm that a supplier’s usage of freshwater does not impact communities’ water access. For another supplier, Tesla participated in the establishment of a committee of independent environmental experts to assess and work with the supplier on environmental risk management. Co-existence between Tesla reviewed industrial and artisanal • Evidence for a supplier’s government engagement in support of artisanal mine site mining operations legalization • Evidence for investments into initiatives supporting responsible artisanal mining Tesla also met with representatives of artisanal mining communities and provided funding to initiatives supporting responsible artisanal mining (see page 109). 107
Battery Supply Chain Environmental and social risk mitigation and improvement of conditions #3 Risk Mitigation and Positive Impact As a result of the activities listed in Step 2, Tesla identified the following focus areas for risk mitigation and improvement of local conditions at or around cobalt, nickel and lithium mine sites in Tesla’s supply chain: Priority area Examples of actions taken by Tesla Protection of forests and Tesla reviewed biodiversity • A supplier’s area of operation in relation to nearby forest areas • A supplier’s reforestation and rehabilitation plans • Written assurance that mining activities did not take place in rainforest areas • Environmental impact assessments Community consultation and Tesla directly engaged with representatives of communities affected by mining operations to engagement and protection review that regular engagement and consultation take place and community needs are of indigenous rights responded to. Tesla also reviewed • Meeting minutes to ensure communities were regularly consulted • Evidence for a best-practice Free, Prior and Informed Consent (FPIC) process, including in coordination with responsible government authorities GHG emissions reduction Tesla’s approach to GHG emissions data collection (see Graph in Step 2) is currently being and air pollution implemented. The data collected will inform the development of concrete actions to reduce Tesla’s Scope 3 emissions. • Based on an initial review, 15 refiners and mine sites in Tesla’s supply chain disclosed that 15 they conducted an LCA Refiners, smelters and mine sites in Tesla’s Cross-cutting Across all risk areas identified, Tesla battery supply chain disclosed they conducted • Reviewed suppliers’ audit frameworks to ensure upcoming audits will cover all areas an LCA identified above • 55 corrective actions agreed to with suppliers related to suppliers’ environmental and social management processes 55 • Expanded environmental and social requirements in supplier contracts, for example related to responsible mining standards, LCAs, GHG emissions footprint disclosure, and Corrective actions agreed to with suppliers transparent and proactive risk disclosure related to their sustainability management • Developed a formal technical collaboration on sustainability with a supplier processes 108
Battery Supply Chain Tesla’s engagement in the DRC and the Fair Cobalt Alliance (FCA) #3 Risk Mitigation and Positive Impact The DRC is an important source of cobalt for Tesla batteries. We will continue supporting sourcing from the DRC provided our responsible sourcing standards are met. While Tesla does not source cobalt from Artisanal and Small-Scale Mining (ASM), we recognize the importance of ASM for local livelihoods. This is why Tesla provides funding to, and sits on, the Steering Committee of the Fair Cobalt Alliance (FCA), a multi-stakeholder initiative to support the improvement of conditions in communities impacted by artisanal mining through the following activities: • Occupational health and safety awareness raising campaign for mine workers • First aid training for mine workers and selection of safety captains • Distribution of protective equipment to washer women • Creation of savings groups for mining community members paired with financial literacy training • Development of referral system for children engaged in mining activities, including child labor notification protocol, remediation solution packages, and guidelines for case managers on remediation steps, in collaboration with the NGO, Save the Children • Trainings related to child rights • Electrification of five schools covering students through the distribution of solar-chargeable portable lamps • A marketplace and football field selected for the placement of lighting poles Attendees of a first aid training organized by the FCA in the DRC 109
Battery Supply Chain Collaboration with industry initiatives #4 Collaboration with Industry Initiatives Tesla understands that many of the environmental and social issues in global EV supply chains do not concern Tesla, alone. Tesla is actively engaging in multi-stakeholder forums and industry groups to find industry-wide solutions to industry-wide questions: • Initiative for Responsible Mining Assurance (IRMA): Tesla joined IRMA as a Member in 2021 to support responsible mining practices and transparent and robust audit processes that emphasize community interviews. It is important to Tesla that NGOs and communities actively participate in third-party audits of mines against the IRMA Standard, as their perspectives provide greater context on mining operations and the impacts of extraction, while also increasing accountability and identifying opportunities for improvement. • Global Battery Alliance (GBA): Tesla has been involved in the GBA since 2020 and has served on the GBA Board and Battery Passport Steering Committee since 2021. Tesla’s goal as part of the GBA is to advocate for high standards for responsible battery materials sourcing, align with EU regulatory requirements, and support the development of actionable guidance related to GHG emissions data collection, recycling, and in- country environmental and social projects. • Responsible Minerals Initiative (RMI): Tesla is a member of the RMI to support the RMI’s refiner audit programs and industry-wide responsible sourcing dialogue. • IFC Net Zero Roadmap Working Group: Tesla has participated in the IFC Working Group since early 2022 to provide a downstream perspective in the development of actionable guidance for mine sites to reduce carbon emissions. • Re|Source: Tesla participates in the supply chain-wide Re|Source consortium to pilot blockchain-supported traceability in the cobalt supply chain. Tesla offers insights from an OEM perspective on metrics critical to traceability efforts and works with the consortium towards the first end-to-end blockchain-enabled tracing of cobalt material starting from Tesla’s supplier in the DRC to Gigafactory Shanghai. • Fair Cobalt Alliance (FCA): Please see the previous page. 110
Battery Supply Chain Outlook for battery supply chain responsible sourcing: Formalization and expansion Outlook Tesla’s battery responsible sourcing program is still relatively new. Yet, the program has achieved several important milestones this last year, including the development and initial implementation of a system to identify environmental and social risks in the battery supply chain and concrete progress towards mitigation and improving the situation of stakeholders impacted by Tesla’s battery supply chain. In 2022, Tesla plans to continue building on momentum of the program and improve on the data points shared in this report, including the development of supply chain GHG emissions reduction plans and further projects and investments in mining countries to have a positive environmental and social impact. Tesla will then explore an expansion to manganese, graphite, copper and mica. 111
Responsible Sourcing Tesla’s Supplier Audit program Supplier Audit Program In 2018, Tesla initiated its Supplier Audit program with the objective to extend our supplier performance evaluation to key environmental and social impact metrics relevant to Tesla’s business. This program extension was introduced at the time when Tesla was transitioning from a small automotive manufacturer to a company gaining recognition as the leader in electrical vehicle production. We recognized that this growth came with an increased ability to impact positive change on the practices of our suppliers, but also with an increased responsibility to drive such change in line with our mission statement. During the program pilot phase, we focused our efforts on suppliers that we deemed high risk based on their industry or the use of potentially dangerous processes and/or chemicals in the manufacturing of our parts. We chose to utilize the Responsible Business Alliance’s (RBA) Validated Assessment Program (VAP) as the basis for our audits. The RBA’s VAP is an audit protocol globally recognized for its breadth of topics and stringent requirements for supplier completion. It covers nearly 200 checkpoints across labor, health and safety, environmental, ethical and management system topics. Audits are conducted by independent third parties that are approved by the RBA, and all auditors must undergo training by the RBA on the audit standard and its implementation ensuring a globally and industry-wide standardized approach. In any case where any priority non-conformance (the most significant type) occurs, our audit procedures require that suppliers undergo a closure audit. These closure audits – which are a follow up to the original audit where the non-conformances were identified – allow suppliers to address all non-conformances in the earlier audits. Additional audits, rather than an immediate suspension of the business relationship, are preferred to improve working conditions and reduce the risk of continued deficiencies. As of the end of 2021, we had a total of 152 supplier locations go through our supplier audit at least once, representing 144 suppliers, or 10% of 2021 spend with our direct supply base. As part of these audits over 4,000 supplier employee interviews were conducted. 112
Responsible Sourcing Continuing to expand our audit program Supplier Audit Expansion In 2021, Tesla redefined its criteria for determining which of our suppliers are subject to the Supplier Audit program. While in its initial stages the suppliers subject to the audit were mainly located in China, and the updated criteria expanded the scope to include significantly more suppliers globally. When we started our audit program, we had only just announced our plans for Gigafactory Shanghai. We now have six factories across three different continents, and our production volume of vehicles has grown exponentially. As our global footprint and manufacturing grew, so did our supply base. Therefore, the expansion of our audit program was an important step to ensure that our supplier due diligence efforts continue to reflect the realities of our supply chain and can properly identify and address potential risks within our supply base. The criteria on which suppliers are selected to undergo the Supplier Audit is based on an expanded risk assessment approach, looking at Tesla’s exposure to suppliers financially, as well as suppliers’ location. This criteria determines which suppliers are obligated to undergo an audit, but additional suppliers can be nominated by our commercial and supplier industrialization teams where they see value in doing so or the potential to further mitigate risk. With the expanded audit program scope, we are targeting to cover over 50% of our global spend with our direct supply base. As part of our program expansion, we are building on our ability to influence supplier behavior in a positive way. When a supplier is not meeting our expectations, they are obligated to implement corrective action plans to remedy any deficiencies or non-conformances found during the audit process, regardless of the severity. In cases of the highest priority non-conformances, suppliers are required to undergo closure audits to ensure that their corrective action plans have been fully implemented. In cases of less severe non-conformances, suppliers are still required to develop and implement corrective action plans as well as provide evidence to Tesla that those plans have been fully implemented within our expected timelines. Furthermore, we defined a separate category called Zero Tolerance Violations, which, for example, include any violations related to the use of forced or child labor and inhumane treatment of workers. In cases where such instances are discovered, our supply chain leadership will be informed, and a corrective action plan will be developed immediately, together with the supplier. Tesla will transition away from the supplier relationship if the supplier is unable or unwilling to correct the identified issues and improve their operations within a reasonable time frame. 113
Responsible Sourcing How we identify and prioritize risks in our supply chain Identifying Priorities Our Supplier Audit program is an important part of our efforts to identify and address environmental and social risks within our supply chain. These audits allow for a snapshot of a supplier facility’s programs and procedures, but also sets a baseline for future evaluations. Additionally, Tesla utilizes other avenues to evaluate potential risks in our supply chain such as those detailed below. We engaged with several third-party service providers allowing us to continually monitor our supply chain for emerging issues that may affect our suppliers. These include issues related to labor relations, human rights and environmental degradation. This monitoring allows our Global Supply Managers to be notified as soon as information about suppliers becomes public and act by engaging directly with the supplier to understand their plans for correcting the identified risk. Tesla follows the OECD Due Diligence Guidance for Responsible Business Conduct when identifying risks within our supply chain. We require suppliers to cooperate with our efforts and assist in identifying and removing practices within our supply chain that are contradictory to our policies. Our responsible sourcing policies require suppliers to provide requested information regarding potential violations of our policies. Furthermore, we continue to leverage our membership with the RBA to identify upcoming supply chain risks as well as understand industry best practices to address them. We are actively involved with the RMI as well as specific action groups within the organization. In addition, we have utilized many of the RBA tools, such as country risk analysis to understand inherent risks in our supply chain and RBA-Online to collect information on corporate and factory-specific supplier performance. 114
Responsible Sourcing Across all audits, we found no instances of child labor, forced labor or inhumane treatment of workers Supplier Audit Findings The table below details findings of our audits across all suppliers regardless of severity and includes initial audits as well as closure audits. Through July 2021, our suppliers have addressed and remedied 100% of priority non-conformances, with the remaining open priority findings to be addressed in upcoming closure audits. Our initial focus on high-risk suppliers allowed us to cover more than 70% of this group in the first three years of the audit program and gave us an understanding of suppliers to prioritize in an expanded program. In all audits conducted at Tesla's request at supplier manufacturing facilities producing Tesla products, we found no instances of child labor, forced labor or inhumane treatment. Supplier Audit Findings (2018-2021) 1 1 2018 2019 2020 2021 Audits Conducted 12 108 81 41 Average Non-Conformance per Audit 28 21 16 15 Breakdown of Findings by Topic (%) Labor 30% 30% 31% 37% Health & Safety 30% 27% 30% 33% Environment 14% 14% 13% 14% Ethics 6% 4% 2% 1% Management Systems 20% 25% 24% 15% Total 100% 100% 100% 100% In 2021, the five most common findings were related to (% of total findings within each category)2: 1. Working Hours (20.4%): no more than 60 hours work per week, overtime is voluntary, one day off per seven days 2. Emergency Preparedness (11.1%): proper permitting, emergency risk assessment at 11.1% of total findings; 3. Wages and Benefits (9.4%): proper calculation of regular and overtime wages, timely payment of wages; 4. Occupational Safety (7.5%): availability of PPE, proper permitting; and 5. Freely Chosen Employment (5.5%): contract provided in worker’s native language, no excessive penalty for leaving position 1 Over the past two years, global pandemic conditions have significantly impacted our suppliers’ ability to schedule on-site audits, leading to a decrease in our annual audit numbers. 2 The colors of percentages above indicate their inclusion in broader categories in the table. For example, Working Hours is a subcategory of Labor 115 and, therefore, both are colored blue.
Supporting Materials
Summary –Corporate Governance Topic Description Page(s) Sound corporate governance is critical to our mission. We are committed to establishing an operating framework Introduction that exercises appropriate oversight of responsibilities at all levels throughout the company and manages its 11 - 12 affairs consistent with high principles of business ethics. Our unique business requires a unique approach to corporate governance. And our mission requires a long-term Our Approach to Corporate focus that we believe will ultimately maximize value to our employees and our stockholders. Our corporate 13 Governance governance structure has facilitated several key decisions which might have appeared counter-intuitive to some, but which have set up the Tesla to achieve long-term success. Board Committees (as of March 1, The Board has four standing committees — the Audit Committee, the Compensation Committee, the Nominating 2022) and Corporate Governance Committee and the Disclosure Controls Committee — which are each further 14 - 15 described in this section. Our compensation philosophy reflects our long-term mission and our startup origins. We emphasize structuring Compensation Philosophy compensation to reward our named executive officers based on performance, and equity awards weigh heavily in 16 our named executive officers’ total compensation, including awards that vest upon the achievement of clear and measurable milestones. Tesla builds products with privacy and security at their core. Additionally, managing data privacy is a shared task Data Privacy and Cybersecurity through all levels of our organization. Our privacy principles are: 1. We build privacy into our products from start 17 - 18 to finish; 2. We give customers choices about their data; 3. We maintain trust through transparency; and 4. We safeguard personal data. Theethical treatment of all people and regard for human rights is core to our mission of a sustainable future. We believe all businesses within our supply chain have a responsibility to share our respect for human rights. Our Human Rights human rights policy is the formalization of our commitment to uphold and respect these rights and the values 19 - 20 they represent. We have a zero-tolerance policy when it comes to child or forced labor and human trafficking by our suppliers. 117
Summary –People and Culture Topic Description Page(s) Tesla's employees are its greatest asset and critical to achieving our mission. Our People Strategy is centered on Introduction providing meaningful work, a respectful, safe, inclusive and equitable workplace, compensating our people well, 22 and making our benefits an outlier. Our employee count has grown ~70 fold over the past decade and, in just over ten years, created nearly 100,000 Attracting Employees direct jobs. Whether it is through our direct hiring opportunities, internships or workforce development 23 - 27 programs, interest in joining Tesla’s mission is at an all-time high. We had more than 3,000,000 unique applicants globally in 2021 alone. Tesla provides a highly competitive wage that meets or exceeds the wages of comparable manufacturing roles, Compensating Employees even before equity and benefits are factored in, and we want our benefits to be an outlier in the manufacturing 28 - 32 industry. We have an annual pay equity program in place, designed to assess whether similarly situated employees are paid in a similar manner after accounting for a range of variables. As Model 3 has become the best-selling premium sedan globally and our profitability (operating margin) has rose Retaining Employees to the highest in the industry, employee satisfaction has improved. This has fueled our ability to expand 33 - 34 dramatically and provide career opportunities for many strong performers. As nearly 70% of our leadership is promoted from within Tesla, our employees are surrounded by examples of successful progression. We are proud to be a majority-minority company with a large representation of employees from communities Diversity, Equity and Inclusion that have long struggled to break through the historic roadblocks to equal opportunity in the U.S. As of 35 - 41 December 31, 2020, 34% of our directors and vice presidents are people of color. This year we published our latest EEO-1 data for the first time. We strive to create an environment where people love to come to work every day. With over 100,000 Respectful Workplace employees as of March 2022, challenges arise, and we address them head on. In 2021, we re-doubled our efforts 42 - 43 to educate employees and managers that any form of discrimination must be reported. Employee engagement drives productivity, satisfaction and loyalty and plays a critical role in employee Employee Engagement retention. Tesla’s engagement initiatives strive to make employees feel informed, valued and respected, while 44 company-wide open-door policies with leaders empower employees to make their ideas heard. We are committed to providing disaster relief through product donations. Our disaster relief efforts have Disaster Relief provided 100% clean, emissions free emergency power to people in Ukraine, New Orleans after Hurricane Ida, 45 - 46 and Kentucky and Texas after sever winter storms. We also provided free supercharging to customers in countries surrounding Ukraine. Environmental, Health, Safety and In 2021, our focus remained on protecting people, the planet, our property and products. We recently deployed Security our new EHS&S system – MyEHS – in order to better collect and manage data, allowing us to make decision that 47 - 54 reduce risk. Furthermore, in 2021, our ATSM Global Serious Injury Rate remained below the industry average. 118
Summary –Environmental Impact Topic Description Page(s) Lifecycle Analysis of Tesla Vehicles Regardless of where they are driven (U.S., Europe or China), a Model 3 and Model Y emit far fewer greenhouse versus Average ICE gas emissions per mile than a comparable ICE. Moving the grid toward more renewables and making our 56 – 67 operations and supply chain less GHG intensive will only make this dynamic more pronounced as time goes on. We have disclosed our full Scope 1 and Scope 2 (location-based) emissions this year. We have also disclosed the GHG Emissions: Scope 1, 2, 3 amount of CO2e emitted through the use of our vehicles (part of Scope 3). The global Supercharger network and 68 – 69 home charging in California were both 100% renewable in 2021, achieved through a combination of onsite resources (for the Supercharger network only) and annual renewable matching. New research shows that fossil fuels are alone responsible for more than 8 million premature deaths annually, or NOx, Particulates and Other Pollutants almost one out of every five deaths globally, double previous estimates. Zero tailpipe emissions is a commonly 70 overlooked benefit of EVs. Tesla Semi's Impact on Emissions Tesla Semi is poised to make a large impact: in the U.S., combination trucks make up just 1.1% of the vehicle fleet 71 but account for 17.9% of annual emissions. Waste Generated per Vehicle As we continue to build new, more efficient factories our ability to limit packaging and reduce waste increases. Manufactured Waste generated per vehicle in Shanghai production is 60% less than our manufacturing in the U.S. We continue 72 to push for innovative approaches to reducing waste as we expand our global operations. Water Used per Vehicle Manufactured Water use per vehicle produced by Tesla was again below the industry average in 2021. Our new factories such as 73 - 74 Gigafactory Berlin-Brandenburg will set a new standard when it comes to low water use per vehicle. In 2021, Tesla delivered more than 2x as many EVs as our next closest competitor, helping drive $1.5bn in revenue Emissions Credits from selling regulatory credits. This money is being used to accelerate our production capacity deployment in 75 direct support of our mission. 119
Summary –Product Impact Topic Description Page(s) Product Affordability Model 3 is price competitively with ICE equivalents. But, when compared on a total cost of ownership basis, the (Price Equivalency & Model 3 is much closer to a Toyota Camry on all-in cost per mile than to an ICE equivalent such as a BMW 3 77 - 78 Total Cost of Ownership) Series. Our data shows that Tesla vehicles are being driven more than average vehicles in the U.S., suggesting that they Product Usage & Usability are generally being used as a customer’s primary vehicle. The superior range of our vehicles and a robust global 79 - 80 Supercharger Network makes this possible. At Tesla, safety features are not optional. Our full suite of safety features comes standard with every vehicle. Vehicle Safety When we design vehicles, first and foremost, we want them to be safe. Our active safety features are powered by 81 – 84 eight cameras, a neural-net computer and learnings from our fleet of over two million cars. In 2021, we recorded 0.22 crashes for every million miles driven in which drivers were using Autopilot technology Autopilot Safety (Autosteer and active safety features). For drivers who were not using Autopilot technology (no Autosteer and 85 active safety features), we recorded 0.77 crashes for every million miles driven. By comparison, NHTSA’s most recent data shows that in the United States there are 1.81 automobile crashes for every million miles driven. Data Driven Safety Tesla strived to go beyond industry standard testing. We leverage data from our fleet of over two million cars to 86 - 87 better understand accidents and build solutions around them. Passive Safety & Tesla Safety Awards Since 2019, Tesla vehicles earned 5-star ratings from safety rating agencies across the U.S., Europe and Australia. 88 - 89 From 2012 to 2021, there has been approximately five Tesla vehicle fires for every billion miles traveled. By Fire Risk comparison, data from the National Fire Protection Association (NFPA) and U.S. Department of Transportation 90 show that in the U.S. there are 53 vehicle fires for every billion miles travelled. Pairing energy storage with renewables is required to transition our grid to zero-emission sources. In 2021, in Solar + Storage Products order to meet demand that is well in excess of supply for energy storage products, Tesla began building a new 91- 92 production facility capable of producing 40,000,000 kWh of energy storage per year. Electric grid disturbances in the U.S. have increased dramatically over the last 15 years. Our solar and storage Resilience of the Grid products not only deliver cost savings and energy independence, but they also harden the grid from adverse 93 events in a cost-effective and environmentally friendly manner. 120
Summary –Supply Chain Topic Description Page(s) Protecting human rights and the environment is core to our procurement strategy. Our responsible sourcing Introduction strategy aims to increase the share of direct procurement and continually improve local conditions of the 95 communities from where we source. Tesla is building capacity to recycle manufacturing scrap and end of life batteries in order to close the loop on Battery Recycling battery raw materials. By the end of 2021, our battery recycling facility at Gigafactory Nevada achieved a 96 - 97 production rate of over 50 tons of recycled material per week. Our responsible sourcing program is based on the OECD Due Diligence Guidance for Responsible Mineral Supply Alignment with Best Practices Chains. This means Tesla collects data from its supply chain (including through audits), translates this data into 98 on-the-ground actions and discloses the outcomes in our annual Impact Report. We have prioritized responsible sourcing activities for cobalt, lithium and nickel given their unique significance to Battery Supply Chain EVs and energy storage. To ensure we are appropriately managing risk, we continue to map our supply chain, 99 - 111 conduct in third-party audits and on-the-ground engagements, and collaborate with industry initiatives to ensure our suppliers are living up to our strict standards. In 2018, Tesla initiated its Supplier Audit program with the objective to extend our supplier performance Responsible Sourcing & evaluation to key environmental, social, and governance metrics relevant to Tesla’s business. As of the end of 112 - 115 Tesla Supplier Audit Program 2021, we had a total of 152 supplier locations go through our Suppler Audit at least once, representing 144 suppliers, or 10% of 2021 spend with our direct supply base. 121
Appendix Key Metrics Average Lifecycle Emissions (gCO2e/mi) Delivery-weighted U.S. Average Manufacturing Phase use-phase Total New York State Manufacturing Phase use-phase Total Model 3 Ridesharing Use Model 3 Ridesharing Use (solar charged) 29 0 29 (solar charged) 29 0 29 Model 3 Personal Use Model 3 Personal Use (solar charged) 70 0 70 (solar charged) 70 0 70 Model 3 Ridesharing Use Model 3 Ridesharing Use (grid charged) 10 111 121 (grid charged) 10 78 88 Model 3 Personal Use Model 3 Personal Use (grid charged) 51 111 162 (grid charged) 51 78 129 Avg. Mid-Size Premium ICE 48 417 465 Avg. Mid-Size Premium ICE 48 417 465 Delivery-weighted Europe Average Austria Model 3 Ridesharing Use Model 3 Ridesharing Use (solar charged) 31 0 31 (solar charged) 31 0 31 Model 3 Personal Use Model 3 Personal Use (solar charged) 100 0 100 (solar charged) 100 0 100 Model 3 Ridesharing Use Model 3 Ridesharing Use (grid charged) 12 48 60 (grid charged) 12 35 47 Model 3 Personal Use Model 3 Personal Use (grid charged) 81 48 130 (grid charged) 81 35 116 Avg. Mid-Size Premium ICE 63 417 480 Avg. Mid-Size Premium ICE 63 417 480 Delivery-weighted China Average Sichuan Province Model 3 Ridesharing Use Model 3 Ridesharing Use (solar charged) 31 0 31 (solar charged) 31 0 31 Model 3 Personal Use Model 3 Personal Use (solar charged) 100 23 123 (solar charged) 100 4 105 Model 3 Ridesharing Use Model 3 Ridesharing Use (grid charged) 12 172 184 (grid charged) 12 33 45 Model 3 Personal Use Model 3 Personal Use (grid charged) 81 172 253 (grid charged) 81 33 114 Avg. Mid-Size Premium ICE 63 417 480 Avg. Mid-Size Premium ICE 63 417 480 122
Appendix Key Metrics GHG Emissions (tCO2e) Scope 2 Scope 1 & 2 Emissions Scope 1 (location based) Scope 3 Emissions Use of Sold Product Manufacturing 124,000 342,000 Scope 3 1,954,000 SSD 31,000 35,000 Other 30,000 26,000 Total* 185,000 403,000 Waste Generated in Manufacturing Waste Generated in Global Manufacturing1 Diverted from Waste Generated in Vehicle Manufacturing Diverted from 2 (2021; tons) Disposal Directed to Disposal (2021; kg per vehicle) Disposal Directed to Disposal Hazardous Waste 14,432 20,502 Hazardous Waste 14 22 Non-Hazardous Waste 254,541 15,701 Non-Hazardous Waste 271 16 Total Waste Generated 268,973 36,203 Total Waste Generated per Vehicle 285 38 Water Withdrawal for Manufacturing (cubic meters) 1 2 Total Fresh Water Withdrawal 2019 2020 2021 Total Fresh Water Withdrawal per vehicle 2019 2020 2021 Major Manufacturing Sites 1,765,374 2,082,163 2,874,904 Major Manufacturing Sites 2.43 3.10 3.02 Uptime of Tesla Supercharger Sites Uptime of Supercharger Sites 2019 2020 2021 Uptime 99.90% 99.74% 99.96% Vehicle Safety Numbers of Vehicular Accidents per Million Number of Vehicle Fires per Billion Miles Miles Driven (2021) Autopilot Engaged No Active Safety Driven 2012 - 2019 2012 - 2020 2012 - 2021 Tesla 0.22 0.77 Tesla 5.71 4.88 4.76 123 1 Includes all major manufacturing sites: Fremont Factory and supporting facilities, Gigafactory Nevada, Gigafactory New York, Tesla Grand Rapids and Gigafactory Shanghai. 2 Includes major manufacturing sites dedicated to vehicle production: Fremont Factory and supporting facilities, Gigafactory Nevada Vehicle Operations, Tesla Grand Rapids and Gigafactory Shanghai. *PwC performed an attest review engagement on this metric. See their report on page 138.
Appendix Key Metrics Workplace Safety Global Total Recordable Injuries per 1,000 ASTM Level One Rate 2019 2020 2021 Vehicles Produced 2019 2020 2021 Tesla 2.6 3.6 Tesla 4.9 3.3 2.9 Days Away from Work, Restricted Time (DART) 2019 2020 2021 Fremont Factory 4.4 3.5 4.4 124 1 Includes all major manufacturing sites: Fremont Factory and supporting facilities, Gigafactory Nevada, Gigafactory New York, Tesla Grand Rapids and Gigafactory Shanghai. 2 Includes major manufacturing sites dedicated to vehicle production: Fremont Factory and supporting facilities, Gigafactory Nevada Vehicle Operations, Tesla Grand Rapids and Gigafactory Shanghai. 3 Please see page 137 of the appendix for detailed explanation of energy consumption figures.
Appendix SASB Response Topic Accounting Metric Response Product Safety Percentage of models rated by NCAP programs with overall 5-star safety rating, by See page 81 – 90 for our discussion of vehicle safety. See page 89 for region specifics related to our 5-star safety ratings. Product Safety Number of safety-related defect complaints, percentage investigated Tesla reviews 100 percent of NHTSA VOQ complaints filed for any and all Tesla vehicles produced Number of U.S. safety recalls in 2021: 11 (1) Product Safety Number of vehicles recalled (number conducted with OTA software update*) Number of global safety recalls in 2021: 12 (2) Total units in U.S. affected by these recalls in 2021: 646,862 (11,704) Total units globally affected by recalls in 2021: 1.6m (297,266) Labor Practices Percentage of active workforce covered under collective-bargaining agreements No Tesla employees; employees of some contractors and service providers are covered by CBAs Labor Practices (1) Number of work stoppages and (2) total days idle 0 / 0 Fuel Economy & Use-phase Sales-weighted average passenger fleet fuel economy, by region See pages 59 – 63 for discussion / data Emissions Fuel Economy & Use-phase Number of (1) zero emission vehicles (ZEV), (2) hybrid vehicles, and (3) plug-in Tesla only sells zero emission vehicles. In 2021, we delivered 936,222 Emissions hybrid vehicles sold vehicles Fuel Economy & Use-phase Discussion of strategy for managing fleet fuel economy and emissions risks and See page 63 Emissions opportunities Materials Sourcing Description of the management of risks associated with the use of critical materials See supply chain section, pages 95 - 115 Materials Efficiency & Recycling Total amount of waste from manufacturing, percentage recycled See page 72 We make the best effort to recycle every battery pack we can. See page Materials Efficiency & Recycling Weight of end-of-life material recovered, percentage recycled 95 - 96 for a discussion on recycling. Tesla is still working to collect end of life data as our vehicles are relatively new in the auto market Materials Efficiency & Recycling Average recyclability of vehicles sold See page 95 – 96 for a discussion on recycling Number of vehicles manufactured 930,422 Number of vehicles sold 936,222 *OTA designation indicates how many recalls / units were able to be satisfied using over-the-air updates. When a recall is fixed with an OTA update it obviates the need for a visit by the customer to a Tesla Service Center. 125
Appendix In 2021, we conducted a comprehensive materiality analysis to better understand the key ESG topics that were Our Materiality Analysis most salient to our diverse group of stakeholders. To start, we identified over 40 issues in key areas that could directly or indirectly impact our business. The topics ranged from economic, environmental, social and governance issues. These issues were identified from four components: (1) a competitive landscape review, (2) interviews with investors and other key external stakeholders, (3) industry reports and documented research, such as the World Economic Forum’s 2021 Global Risks Report and (4) external ESG frameworks relevant to our industry and regulatory requirements across global capital markets. Tesla’s Sustainability Council refined the list of 40 key issues into a survey containing 25 questions in an effort to help us prioritize these topics for operational management and disclosure in this year’s Impact Report. As 1. Environmental Management, Reducing Carbon part of the assessment, we surveyed our key stakeholders, asking them to rate the identified economic and ESG 2. Quality Management– Product Safety topics on a scale of 1-5, based on their perceived importance and impact to Tesla’s business. A total of 2,168 3. Employee Workplace Safety individuals from Tesla and approximately 40 external partners, including trade associations, universities, 4. Employee Attraction, Retention, Development suppliers, environmental consultants, nonprofits and local administrators, responded to the survey. 35% of 5. Ethical Business Conduct, Integrity, Transparency responses came from North America, 57% from China and 8% from Europe. Below are the top issues identified 6. Data Protection, Cybersecurity by our materiality analysis, in order of importance to survey responders. 7. Supply Chain Management, Sustainable Materials/Products Tesla Materiality Matrix 8. Customer Satisfaction, Trust and Loyalty Higher 9. Company Brand and Mission 1 10. Employee Health and Wellness 11. Company’s Intellectual Property, Innovation, R&D Key: 12. Renewable Energy s 13. Waste Management/Recycling r Economic e d 14. Company Financial Health ( Product Sold, l Profitability) ho e Environment 15. Employee Compensation and Benefits k a 16. Air Quality, Reducing Toxic Emissions t 17. New Markets, EV, Autonomous Cars n S o Social 18. Labor Relations e 18 7 4 19. Water Management nc ue 20 3 20.Diversity, Equity and Inclusion l 23 19 13 2 nf Governance 21. Climate Change and Risk Management I 22 10 6 22.Biodiversity Preservation, Natural Resource 25 21 5 Conservation 17 15 11 16 12 8 23.Human Trafficking, Forced Labor 24 14 9 24.Critical Events, Disaster Relief, Pandemic 25.Community Engagement, Economic Development Lower Impact to Tesla Business Higher 126
Appendix Supply Chain Policies The following tables provide summaries of our responsible sourcing policies, the full text of which can be found on our Responsible Sourcing Policies page: Tesla Human Rights Policy Tesla believes the ethical treatment of all people and regard for human rights is core to our mission of a sustainable future and believe all businesses within our supply chain have a responsibility to support our mission and share our respect for human rights. We endorse and base our definition of human rights on the United Nation's Universal Declaration for Human Rights (“UDHR”). The UDHR focuses on dignity, respect, and equality, without discrimination, for all people. We are committed to upholding these rights and values throughout our value chain – including with respect to our employees, customers, shareholders, suppliers, and the communities in which we operate. Health and Safety Respectful Workplace and Equal Opportunities Environmental Protection Suppliers are responsible for ensuring that their employees and Tesla recognizes the value of different backgrounds and We expect our suppliers to share our goal of recognizing contractors are provided with a safe and healthy work perspectives in our workforce, and fully promotes equal environmental protection as a key principle of a sustainable environment. opportunity for all employees, both current and prospective. future. Just as we do not discriminate on the basis of race, color, religion, creed, sex, sexual orientation, gender expression or identity, national origin, disability, medical condition, military and veteran status, marital status, pregnancy or any other characteristic protected by law, regulation or ordinance, we require our suppliers to similarly respect the people in their workforces. Child Labor and Young Workers Relationship with Communities Indigenous Rights Tesla strictly follows local and national laws restricting the Tesla is dedicated to being a responsible member of the The mining industry on which Tesla relies to source many raw employment of underage workers. Regardless of local laws, no communities in which we live and operate. This goes beyond our materials that go into our products has historically had an workers at a facility or location that provides materials used in ability to create jobs and contribute to local value creation. We adverse impact on the rights of indigenous peoples and Tesla products may be under the age of 15. expect suppliers to also take every effort to continuously communities in the areas in which they operate. For all raw improve the positive aspects and reduce any negative impact of material extraction and processing used in Tesla products, we their operations on the local community, including with respect expect our mining industry suppliers to engage with legitimate to environmental, social, and other quality of life factors. representatives of indigenous communities and include the right to free and informed consent in their operations. 127
Appendix Supply Chain Policies The following tables provide summaries of our responsible sourcing policies, the full text of which can be found on our Responsible Sourcing Policies page: Tesla Responsible Materials Policy Suppliers are required to use reasonable efforts to ensure that Materials Explicitly Covered: Tesla requires suppliers to document their efforts to monitor their parts and products supplied to Tesla do not contribute to • Cassiterite (tin); their supply chain for any red flags indicating the use of child or armed conflict, human rights abuses, or environmental • Columbite-tantalite (tantalum); forced labor or contribution to conflict or human rights abuses degradation, regardless of sourcing location. For all materials • Cobalt; as well as environmental impacts in the mining or processing of used in Tesla products, Tesla requires its suppliers to establish • Gold; these materials throughout the value chain. Suppliers must policies, due diligence frameworks, and management systems • Lithium; implement due diligence programs for the value chains of these consistent with the • Mica; OECD Due Diligence Guidance for • Nickel; materials and are expected to use the RMI’s reporting template Responsible Supply Chains of Minerals from Conflict-Affected • Wolframite (tungsten); for the collection of information where such a template is and High-Risk Areasor the OECD Guidelines for Multinational • And any derivatives of the above. available. Enterprises. For all other materials, Tesla will continuously assess their sourcing for potential risks and red flags, and where any are identified Suppliers are required to provide information upon request on will engage with those suppliers to address any issues and require cooperation with our efforts. their sourcing, due diligence efforts and findings for all materials included in the responsible materials policy. 128
Appendix Supply Chain Policies The following tables provide summaries of our responsible sourcing policies, the full text of which can be found on our Responsible Sourcing Policies page: Tesla Supplier Code of Conduct Labor Suppliers must commit to uphold the human rights of workers, and to treat them with dignity and respect as understood by the international community. This applies to all workers including temporary, migrant, student, contract, direct employees, and any other type of worker. Forced, bonded (including debt bondage) or indentured labor, involuntary or exploitative prison labor, slavery or trafficking of persons is not permitted. All workers must be Freely Chosen provided with a written employment agreement in their native language that contains a description of terms and conditions of employment. All work must be voluntary, and Employment workers shall be free to leave work at any time or terminate their employment without penalty if reasonable notice is given as per worker’s contract. Workers shall not be required to pay employers’ agents or sub-agents’ recruitment fees or other related fees for their employment. Child labor is not to be used in any stage of manufacturing. The term “child” refers to any person under the greater of (i) the age of 15, (ii) the minimum applicable legal age Young Workers for completing compulsory education in a country, or (iii) under the minimum legal age for employment in the country. Workers under the age of 18 (Young Workers) shall not perform work that is likely to jeopardize their health or safety, including night shifts and overtime. If child labor is identified, assistance and remediation according to the stricter of international standards or local standards shall be provided. Working hours are not to exceed the maximum set by local law. Further, a workweek should not be more than 60 hours per week, including overtime, except in emergency or Working Hours uncommon circumstances. All overtime must be voluntary. Workers shall be allowed at least one day off every seven days, defined as a rest period of at least 24 consecutive hours every seven days. Suppliers must keep employee working hour and pay records in accordance with local and national laws and provide records to Tesla upon request. Non- Suppliers should be committed to a workplace free of harassment and unlawful discrimination. Companies shall not engage in discrimination or harassment based on race, Discrimination/Non- color, age, gender, sexual orientation, gender identity and expression, ethnicity or national origin, disability, pregnancy, religion, political affiliation, union membership, Harassment covered veteran status, protected genetic information or marital status in hiring and employment practices such as wages, promotions, rewards, and access to training. Suppliers recognize that in addition to minimizing the incidence of work-related injury and illness, a safe and healthy work environment enhances the quality of products and Health and Safety services, consistency of production and worker retention and morale. Suppliers also recognize that ongoing worker input and education are essential to identifying and solving health and safety issues in the workplace Worker potential for exposure to health and safety hazards (chemical, electrical and other energy sources, fire, vehicles, and fall hazards, etc.) are to be identified and Occupational Safety assessed, mitigated using the Hierarchy of Controls, which includes eliminating the hazard, substituting processes or materials, controlling through proper design, implementing engineering and administrative controls, preventative maintenance and safe work procedures (including lockout/tagout), and providing ongoing occupational health and safety training. Emergency Potential emergency situations and events are to be identified and assessed, and their impact minimized by implementing emergency plans and response procedures Preparedness including emergency reporting, employee notification and evacuation procedures, worker training, and drills. Emergency plans should also include appropriate fire detection and suppression equipment, clear and unobstructed egress, adequate exit facilities, contact information for emergency responders, and recovery plans. Worker exposure to chemical, biological, and physical agents is to be identified, evaluated, and controlled according to the Hierarchy of Controls. If any potential hazards Industrial Hygiene were identified, suppliers shall look for opportunities to eliminate and/or reduce the potential hazards. When hazards cannot be adequately controlled by such means, workers are to be provided with and use appropriate, well maintained, personal protective equipment free of charge. Health and Safety Suppliers shall provide workers with appropriate workplace health and safety information and training in the language of the worker or in a language the worker can Communication understand for all identified workplace hazards that workers are exposed to, including but not limited to mechanical, electrical, chemical, fire, physical hazards, pathogens, toxins, and other health related risks. 129
Appendix Supply Chain Policies The following tables provide summaries of our responsible sourcing policies, the full text of which can be found on our Responsible Sourcing Policies page: Tesla Supplier Code of Conduct (continued) Environment Suppliers recognize that environmental responsibility is integral to producing world-class products. Suppliers shall identify the environmental impacts and minimize adverse effects on the community, environment, and natural resources within their manufacturing operations, while safeguarding the health and safety of the public. Environmental All required environmental permits (e.g. discharge monitoring), approvals, and registrations are to be obtained, maintained, and kept current and their operational and Permits and reporting requirements are to be followed. Reporting Pollution Prevention Emissions and discharges of pollutants and generation of waste are to be minimized or eliminated at the source or by practices such as adding pollution control equipment; and Resource modifying production, maintenance, and facility processes; or by other means. Reduction Energy Consumption Suppliers are to establish a greenhouse gas (“GHG”) data or all products and related services supplied to Tesla upon request. Energy consumption and all relevant Scopes 1 and Greenhouse Gas and 2 greenhouse gas emissions (using the GHG protocol) are to be tracked, documented, and publicly reported. Where such tracking is not currently available Suppliers Emissions should establish a plan to implement tracking within one-year and provide the data and/or components required to calculate GHG emissions. Ethics To meet social responsibilities and to achieve success in the marketplace, Suppliers and their agents are to uphold the highest standards of ethics. Business Integrity The highest standards of integrity are to be upheld in all business interactions. Suppliers shall have a zero-tolerance policy to prohibit any and all forms of bribery, corruption, extortion, and embezzlement. Disclosure of All business dealings should be transparently performed and accurately reflected on the Supplier’s business books and records. Information regarding Supplier’s labor, health Information and safety, environmental practices, business activities, structure, financial situation, and performance is to be disclosed in accordance with applicable regulations and prevailing industry practices. Falsification of records or misrepresentation of conditions or practices in the supply chain are unacceptable. Protection of Identity Programs that ensure the confidentiality, anonymity, and protection of supplier and employee whistleblowers are to be maintained, unless prohibited by law. Suppliers should and Non-Retaliation have a communicated process for their personnel to be able to raise any concerns without fear of retaliation. Responsible Sourcing Suppliers shall adopt a policy and exercise due diligence on the source and chain of custody of the cobalt, tantalum, tin, tungsten, and gold in the products they manufacture of Minerals to reasonably assure that they are sourced in a way consistent with the Organization for Economic Co-operation and Development (OECD) Guidance for Responsible Supply Chains of Minerals from Conflict Affected and High-Risk Areas or an equivalent and recognized due diligence framework. 130
Appendix Supply Chain Policies The following tables provide summaries of our responsible sourcing policies, the full text of which can be found on our Responsible Sourcing Policies page: Tesla Supplier Code of Conduct (continued) Suppliers shall adopt or establish a management system with a scope that is related to the content of the Code of Conduct. The management system shall be designed to Management Systems ensure: (a) compliance with applicable laws, regulations and customer requirements related to the Supplier’s operations and products; (b) conformance with this Code; and (c) identification and mitigation of operational risks related to this Code. It should also facilitate continual improvement. Company Corporate social and environmental responsibility policy statements affirming Supplier’s commitment to compliance and continual improvement, endorsed by executive Commitment management, and posted in the facility in the local language. Risk Assessment and A process to identify the legal compliance, environmental, health and safety labor practice and ethics risks associated with Supplier’s operations. Determination of the relative Risk Management significance for each risk and implementation of appropriate procedural and physical controls to control the identified risks and ensure regulatory compliance. Worker Feedback, Ongoing processes, including an effective grievance mechanism, to assess workers’ understanding of and obtain feedback on or violations against practices and conditions Participation and covered by this Code and to foster continuous improvement. Workers must be given a safe environment to provide grievance and feedback without fear of reprisal or Grievance retaliation. Suppliers must periodically provide workers with information on all grievance procedures. No retaliation against workers for raising workplace concerns may be tolerated, including personal attacks, intimidation, or other threats against workers. Corrective Action A process for timely correction of deficiencies identified by internal or external assessments, inspections, investigations, and reviews. Process 131
Appendix Managing a successful and effective Impact program requires robust engagement with an entire ecosystem of Stakeholder Engagement stakeholders – both internal and external to Tesla – including our employees, customers, investors, suppliers, non-profit organizations, educational institutions, governments, the communities in which we operate and trade associations. These groups, among others, all have a stake in the success of our businesses — they are people or organizations who are affected by or can impact our operations. For our business to continue to grow, we need to keep innovating, developing new products and markets all in a sustainable manner. We do this by attracting and retaining the best employees, serving our customers and investors and working with non-profits, our local communities, schools, governments and trade associations to make a positive impact. 132
Appendix In 2015, the United Nations defined a blueprint of 17 sustainable development goals to meet the urgent Tesla’s Alignment with the environmental, political and economic challenges facing our world. We understand that companies can play a United Nations’ Sustainable critical role in providing solutions to these challenges. Our mission to accelerate the world’s transition to Development Goals sustainable energy directly addresses some of these challenges — our products and services have helped to create industry demand for sustainable energy products. In 2021, as part of our Impact program, we reviewed the issues and topics most material to Tesla (identified on page 126) and key areas of focus for the Company and mapped them to the most relevant Sustainable Development Goals: United Nations Sustainable Development Material Issues and Topics and Other Key Areas of Focus Goals: - Technological innovation in manufacturing - Development of zero-emission technologies - Reduction of carbon emissions from transport and energy generation - Increase renewable energy generation - Further improve product affordability and accessibility - Environmental/climate change management and reporting - Reduce carbon footprint across Scope 1, 2 and 3 emissions - Responsible supply chain management and sourcing - Reduce injuries and deaths from traffic accidents - Reduce deaths and illnesses from air, water and soil pollution - Waste reduction and responsible management supply chains - Reduce stress on water systems through efficient use of water in manufacturing - Workforce development, education and training - Diversity, Equity and Inclusion - Human capital management and employee development - Community engagement - Ethics, corruption and bribery, human rights and labor relations - Human trafficking and responsible supply chain management 133
Appendix Metric / Disclosure / Topic Source(s) Methodology / Definition Analysis of sustainability reports by auto OEMs shows unrealistic assumptions for both vehicle life and annual mileage. For those that disclose their methodology we have found that vehicle life is often estimated to be as low as 10 years and annual distance traveled by vehicles as low as 6,200 miles. This compares to an average life of 17 Vehicle use-phase emissions, which represent 80-90% of total automotive emissions years in the U.S. (20 years in Europe) and 12,000 annual miles in the U.S. (and 7,450 in Europe). When taken (included in Scope 3 of ESG reporting), tend to be misreported due to the use of together, even before considering the impacts of using real-world MPG instead of NEDC, WLTP or EPA ratings, this unrealistic assumptions or not reported at all. OEM sustainability reports leads to a drastic under-reporting of Scope 3 emissions. To estimate CO e savings, we first measured the amount of miles driven by our vehicles and kWh of electricity 2 generated and stored by our solar panels and energy storage products at the state, province, and country level for 2021. We then applied an emissions savings factor (in gCO e/mi for miles driven and gCO e/kWh for electricity 2 2 generated), for each state, province, and country to estimate CO2e avoided. For miles driven, the emissions savings factor is the net of estimated emissions from our vehicles and an ICE with a real-world fuel efficiency rating of ~24 mpg. The emissions savings factor is based on grid emissions intensity in each respective location and includes 8.4 million metric tons of CO2e savings Tesla estimate upstream emissions from the production and transport of fuels. Figures based on actual electricity consumption from utility bills for 2018, 2019, 2020 and 2021. 2020 and 2021 figures also include measured consumption for on-site fuel use including propane, diesel and gasoline. Figures for 2012-2017 for electricity, and 2012-2019 for on-site fuel use, are estimated based on actuals scaled for vehicle and Tesla Cumulative Net Energy Impact: 2012–2021 (TWh) Tesla battery production for each respective year and facility. CAIT data: Climate Watch. 2020. GHG Emissions. Washington, DC: World Resources Institute. Available at: https://www.climatewatchdata.org/ghg- emissions. Land Use Data Source: Food and Agriculture Organization of the United Nations. FAO For simplicity, select categories were combined based on similarity of emissions source. Emissions from Agriculture 2020, FAOSTAT Emissions Database. Latest were combined with emissions from Land-Use Change and Forestry under the label “Agriculture, Land-Use Change update: 2020. Accessed: June 2021. and Forestry.” Emissions from Industrial Processes were combined with emissions from https://www.climatewatchdata.org/ghg- Manufacturing/Construction under the label “Industry.” Emissions from Waste, Fugitive Emissions, Other Fuel Global Greenhouse Gas (GHG) Emissions by Economic Sector emissions. Combustion and Bunker Fuels (U.S.-only) were combined under the label “Other Energy.” Figures for peer benchmarking were sourced from the latest available EEO-1 disclosure on each company’s website. For comparability, all figures were converted to percentages of total workforce. Figures for each Tech and Automotive industry were calculated based on an average of the percentages for the companies in each respective industry. Tables on pages 37 and 38 represent the difference in representation in Tesla’s workforce across each category. Companies in the Tech average: Adobe, Alphabet, Amazon, Apple, Cisco, Meta, HPE, Lyft, Microsoft, Netflix, Nvidia, Oracle, Qualcomm, Salesforce, and Uber EEO-1 comparison to industry averages Publicly available EEO-1 disclosures Companies in the Automotive average: Ford and General Motors 134
Appendix Metric / Disclosure / Topic Source(s) Methodology / Definition Scope 1 emissions are direct emissions from owned or controlled sources. Scope 2 emissions (location-based) are indirect emissions from the generation of purchased energy. Scope 3 emissions are all indirect emissions (not included in scope 2) that occur in the value chain of the reporting company, including both upstream and downstream emissions. Emissions from the use of a company’s products are Scope 1, 2 and 3 Emissions Definition Greenhouse Gas Protocol included in Scope 3. 6,500 miles At the moment, the manufacturing process of a Model 3 results in slightly higher GHG emissions than an equivalent combustion engine vehicle. However, based on Estimate is based on the difference in CO2e emissions from the average of manufacturing phase of a Model 3 and the global weighted average grid mix, a Model 3 has lower lifetime emissions than an Model Y and an equivalent ICE which is then divided by the net CO2e savings per mile from a Model 3 and Model Y equivalent ICE after driving 6,500 miles. Tesla estimate versus an equivalent ICE. Net CO2e savings are based on delivery-weighted global grid mix. Figure based on EPA's real-world (5-cycle) testing result of 25.3 MPG across all manufacturers for model year 2021, 70 tons: Lifetime CO emitted by an average combustion engine vehicle (model year which equates to 348gCO /mi, and 200,000 lifetime miles. Excludes CO emitted during fuel production and 2 2 2 2021) sold in the U.S. through its use-phase, excluding CO emitted during the oil Tesla estimate based on the EPA 2021 transportation. refining phase. 2 Automotive Trends Report Note: the EPA's real-world testing cycle is not the same as owner-reported MPG sourced from Consumer Reports. 135
Appendix Metric / Disclosure / Topic Source(s) Methodology / Definition In order to estimate the cradle-to-gate carbon footprints (GWP100) of select benchmark vehicles, a simplified approach of multiplying their curb weights by a carbon intensity of ~5.5 kg CO2e/kg was chosen. This reference value is based on a currently produced mid-size premium sedan that is comparable to the Model 3. The accuracy of this estimate for the other ICE vehicles directly depends on how their material compositions compared to that of the reference vehicle as well as on the existing variability of environmental impact profiles across different geographies and suppliers. As such, the specific carbon footprint (GWP100/kg) of the reference vehicle is only a proxy for the average premium mid-size ICE vehicle. Based on past work on automotive LCAs (Rohde-Brandenburger& Koffler, 2019) (Koffler C. 873 , 2013) (Koffler C. , 2010) (Koffler C. , Krinke, Schebek, & Buchgeister, 2008) (Koffler C. , 2007), the uncertainty of these estimates is estimated to be less than ±20% for a cradle-to-gate system boundary, and therefore less than ±5% once the use-phase is added. The reference manufacturer’s Environmental Certificates are calculated using the same BOM import functionality of the GaBi DfXsoftware used for the Model 3 in the LCA authored by Sphera as well as GaBi 878 databases for all background data. Benchmark mid-size premium ICE vehicles include BMW 330i 2.0, Audi A4 2.0, Mercedes-Benz C300 2.0, Alfa Romeo Giulia 2.0, Volvo S60 2.0, Cadillac ATS 2.0, Lexus IS 300 2.0 and Infiniti Q50 2.0. Benchmark cross-over SUV premium ICE vehicles include BMW X3, Audi Q5, Mercedes GLC, Jaguar F-Pace, AR Manufacturing Phase Emissions for Average Mid-Size Premium ICE Tesla, Sphera Solutions Stelvio, Volvo XC60, Cadillac XT5, Lexus NX and Porsche Macan. Figured based on owner-reported fuel economy from Consumer Reports for the latest available model year (2018- 2020, depending on the make/model). 24.8 MPG is representative of the average of Alfa Romeo Giulia , Audi A4, BMW 330i, Cadillac ATS, Infiniti Q50, Lexus IS 300, Mercedes-Benz C300, and Volvo S60. use-phase GWP100 of ~400 gCO2e/mi includes gasoline production and distribution emissions from GaBi 2019 databases as well as Use-phase Emissions for Average Mid-Size Premium ICE Consumer Reports consideration of bio-fuel mix of gasoline in the U.S. (~12%). Figure inclusive of: raw and semi-finished material production including transportation, mechanical processing and shaping, battery manufacturing, vehicle assembly and paint shop, all fuels and energy (natural gas, electricity, etc.), other auxiliaries (lubricants, water, etc.) and end-of-life disposal. Figure exclusive of: capital goods (e.g., machinery, buildings), infrastructure (e.g., roads, power transmission systems), employee commute, external charging equipment and infrastructure, maintenance and service during use, packaging, transport to recycler, disposal of manufacturing waste, inbound transportation from Tier 1 suppliers, distribution to customers. Excluded activities are estimated to represent minor contributions to the cradle-to-gate as well as the overall LCA results. Where solar and storage are assumed to be a fuel source for the use-phase of the Model 3Y, emissions were included in the manufacturing phase figure. The Model 3Y Rideshare Use (solar charged) scenario is allocated 100% of these emissions on a per mile basis, while the Model 3Y Personal Use (solar charged) scenario is allocated 82% of these emissions and 18% grid-charged emissions on a per mile basis (based on observed supercharging vs. other Manufacturing Phase Emissions for Model 3 and Model Y Tesla split). Use-phase emissions for grid charging are based on Model 3 and Model Y delivery-weighted state, province and country level grid mix based on grid carbon intensity data. U.S. Source: U.S. Department of Energy | E.U. + EFTA Source: IEA | China Source: China Electricity Council's China Power Industry Annual Report 2021 Use-phase emissions calculated using the geographic distribution of the Model 3 and Model Y in each respective region based on Tesla's delivery data, which weights state, province and country level carbon intensity figures and assumes no change in grid mix into the future. This is a conservative assumption based on recent new electricity generation capacity trends and commitments made by states and countries to increase renewable mix on their respective grids. Grid emission intensities include upstream emissions from the production and transport of fuels. Tesla; U.S. Department of Energy; IEA; China Real-world observed efficiency of Model 3 and Model Y over ~30 billion miles, inclusive of energy losses from grid Use-phase Emissions for Model 3 and Model Y Electricity Council to battery, utilized for use-phase emissions calculations (converting gCO e/kWh to gCO e/mi). 2 2 136
Appendix Metric / Disclosure / Topic Source(s) Methodology / Definition To calculate scrappage age of vehicles in a region, sum up annual vehicle sales from the most current year going U.S. Department of Transportation, European back until the sum equals the current vehicle parc size. In order to be conservative, and normalize our figure based Automobile Manufacturers Association, on recent vehicle sales trends in each region, we divided total vehicle parc by average vehicles sales in the International Organization of Motor Vehicle respective regions for 2019 and 2020 (latest available data). This resulted in a scrappage age of 17 years and Manufacturers, Association Auxiliaire De 200,000 miles in the U.S. and 20 years and 150,000 miles for Europe. For simplicity, China assumed to have similar Vehicle useful life L'Automobile useful life to Europe of approximately 20 years and 150,000 miles. Energy Efficiency EPA range in miles/kWh OEM data Figures based on estimated EPA range and usable battery capacity disclosures by OEMs for each model. % of U.S. Vehicle Fleet chart figures calculated using vehicle parc figures from U.S. Department of Transportation. % of U.S. Vehicle Emissions chart figures estimated using vehicle parc, fuel economy and VMT data from U.S. Department of Transportation. Calculation assumes fuel emissions factor for combination trucks are the same as the rest of the vehicle parc and are therefore conservative. Combination trucks use diesel fuel which, according to the Combination Trucks % of U.S. Fleet and U.S. Vehicle Emissions U.S. EPA, U.S. Department of Transportation U.S. EPA, has a higher GHG content versus gasoline used for light duty cars and trucks. OEM data sourced from respective websites and latest available ESG reports. Tesla 2021 figure includes all our major manufacturing facilities dedicated to vehicle production.. It excludes Water Consumption per Vehicle Tesla, OEM Sustainability Reports Gigafactory New York, which produces solar and energy products. Figures reflective of model year 2021 estimates from various sources. Depreciation based on latest MSRP. Model 3 Total Cost of Ownership Tesla, Edmonds, OEM websites, CarEdge RWD figures based on data from the Tesla fleet. 137
Management Assertion Scope 1 & 2 GHG Emissions Overview Table 2: Metrics – GHG Emissions With respect to the greenhouse gas (GHG) emissions metrics for the year ended GHG Emissions and Assessment Criteria1,2,3 Quantity December 31, 2021 presented in table 2 below, which are also included in this Tesla Impact Scope 1 GHG Emissions4 185,000 Metric Tons CO2e Report 2021 as identified by the “*” symbol, management of Tesla, Inc. (Tesla) asserts that Direct GHG emissions occurring from stationary combustion, the GHG emissions metrics are presented in accordance with the assessment criteria set mobile combustion, and process emissions. Scope 2 GHG Emissions (location-based)5 403,000 Metric Tons CO2e forth below. Indirect GHG emissions from the generation of electricity Management is responsible for the selection of the criteria, which management believes purchased by Tesla for site operations. provide an objective basis for measuring and reporting on the GHG emissions metrics, and for the completeness, accuracy, and validity of the GHG emissions metrics. Tesla’s GHG Emissions Disclosure GHG emissions are rounded to the nearest thousand. 1. Tesla considers the principles and guidance of the World Resources Institute (WRI) and the Organizational Boundary World Business Council for Sustainable Development’s (WBCSD) Greenhouse Gas Protocol Initiative’s A Corporate Accounting and Reporting Standard, Revised Edition, and GHG Tesla uses the operational control approach to account for and report its Scope 1 and Protocol Scope 2 Guidance, An amendment to the GHG Protocol Corporate Standard Scope 2 GHG emissions. This includes sites engaged in manufacturing; sales, service, and (together the “GHG Protocol”) to guide the criteria to assess, calculate and report direct delivery; and other activities described below. Data for acquired sites are included once and indirect GHG emissions. the site has been operating for at least a year at the beginning of the reporting period. 2. GHG emissions quantification is subject to significant inherent measurement uncertainty Table 1: Description of Tesla Sites because of such things as GHG emissions factors that are used in mathematical models to Site Type Site Activities calculate GHG emissions, and the inability of these models, due to incomplete scientific Manufacturing Manufacture Tesla products, including vehicles, superchargers, solar tiles, knowledge and other factors, to accurately measure under all circumstances the relationship and energy storage products. Support manufacturing through the design between various inputs and the resultant GHG emissions. Environmental and energy use and manufacture of equipment and tools used at manufacturing sites or by data used in GHG emissions calculations are subject to inherent limitations, given the nature storing manufacturing materials, parts, or finished products. and the methods used for measuring such data. The selection by management of different Sales, Service, Sell products, provide vehicle service, store parts for vehicle service, and but acceptable measurement techniques could have resulted in materially different amounts and Delivery deliver vehicles. or metrics being reported. (SSD) Other Conduct research & development, administration, energy product warehousing and deployment, and other mixed-use warehousing. 139
Management Assertion Scope 1 & 2 GHG Emissions GHG Emissions Disclosure (cont.) 3. Carbon dioxide equivalent (CO2e) emissions are inclusive of carbon dioxide (CO2), nitrous oxide (N2O), methane (CH4), and industrial gases such as hydrofluorocarbons (HFCs), and sulfur hexafluoride (SF ). Perfluorocarbons (PFCs) and nitrogen trifluoride 6 (NF ) are not emitted by Tesla’s sites. These carbon dioxide equivalent emissions utilize 3 Global Warming Potentials (GWPs) defined by the Intergovernmental Panel on Climate Change’s (IPCC) Fifth Assessment Report (AR5 – 100 year) unless a different Assessment Report is already embedded in the emission factor source. Carbon dioxide equivalent emissions are calculated by multiplying actual or estimated energy and fuel usage by the relevant emission factor taking into account the equivalent GWP. All emission factors are updated annually where applicable. 140
Management Assertion Scope 1 & 2 GHG Emissions GHG Emissions Disclosure (cont.) • Tesla classified vehicles in its global fleet by type: diesel medium and heavy-duty vehicles, diesel light-duty trucks, gasoline passenger cars, gasoline light-duty trucks, gasoline heavy- 4. Related to Scope 1 GHG emissions: duty vehicles, and non-road industrial/commercial equipment. Temporary fleet additions for • Stationary combustion (natural gas): operational use were categorized as ‘other’, for which only CO emissions are calculated, 2 • Combustion from stationary equipment and machinery at all Tesla sites. because Tesla does not have detailed information on what type of vehicles were rented and • Global natural gas usage data was collected from monthly utility invoices obtained miles driven. from third-party providers. • CO emissions were calculated by multiplying the relevant emission factor by the volume of 2 • If monthly usage data was not available, Tesla estimated the natural gas usage by diesel and gasoline used by Tesla’s on-road and non-road vehicles for the year ended determining an annual natural gas usage rate per square foot based on actual 2021 December 31, 2021. monthly natural gas usage data for sites in a similar geographic location and type • CH and N O emissions were calculated by multiplying the relevant emission factor 4 2 of site. This rate was then multiplied by the square footage of the site building (depending on vehicle type and age) by the miles driven by Tesla’s on-road vehicles, and by space. the volume of diesel and gasoline used by Tesla’s non-road vehicles, for the year ended • Emission factors: United States (U.S.) Environmental Protection Agency (EPA) December 31, 2021. Emission Factors for Greenhouse Gas Inventories 2022. • Emission factors: U.S. EPA Emission Factors for Greenhouse Gas Inventories 2022. • Process emissions (Gigafactory Nevada lithium-ion battery cell recycling plant): • Stationary and mobile combustion (propane, diesel, and gasoline): • Emissions from processing manufacturing scrap lithium-ion cells at the Gigafactory Nevada • Combustion from emergency and portable generators, powered industrial vehicles cell recycling plant. (e.g., forklifts), temporary space heaters, and other portable equipment (e.g., • The quantity of manufacturing scrap processed was collected from Tesla’s cell recycling plant landscaping equipment) at manufacturing sites. operations team. The concentration of CO2 and CH4 in emissions (emission rates) were • Propane, diesel, and gasoline usage data was collected from invoices and fuel measured during two emissions source tests. GHG emissions were calculated by multiplying reports obtained from third-party providers. the quantity of manufacturing scrap processed, as recorded by the recycling plant operations • Emission factors: U.S. EPA Emission Factors for Greenhouse Gas Inventories 2022. team, by the CO2and CH4emission rates developed based on emissions source tests. • Fleet mobile combustion (diesel and gasoline): • Estimated emissions from the sources above account for approximately 10% of Scope 1 GHG • Combustion from the operation of Tesla’s on-road and non-road vehicles (i.e., emissions. Tesla’s global fleet). • Excluded Scope 1 GHG emissions: Tesla excluded the following sources of GHG emissions which • Diesel and gasoline usage (volume) from Tesla’s global fleet was collected from are estimated to represent less than 5 percent of Tesla’s reported Scope 1 GHG emissions: fuel cards issued by Tesla’s fleet management partner. Vehicle miles driven by Tesla • GHG emissions resulting from propane, diesel, and gasoline combustion at Tesla sites not on-road vehicles was collected from odometer readings and driver logs. engaged in manufacturing. • GHG emissions from refrigerant loss to the atmosphere. • GHG emissions from emergency stabilization of damaged and potentially damaged lithium- ion cells. • GHG emissions resulting from the chemical reaction of two-part polyurethane adhesives 141
Management Assertion Scope 1 & 2 GHG Emissions GHG Emissions Disclosure (cont.) 5. Related to Scope 2 GHG emissions (location-based): • Estimated emissions from the source above account for approximately 5% of Scope 2 • GHG emissions from the generation of electricity purchased by Tesla for site operations. GHG emissions. For sites that include Superchargers (electric vehicle fast charging stations), Tesla did • Excluded Scope 2 GHG Emissions: Tesla excluded the following sources of GHG not include electricity procured for customer use through the Supercharger stations as emissions which are estimated to represent less than 5 percent of Tesla’s reported those emissions are included in Scope 3, Category 11 Use of Sold Products. Scope 2 GHG emissions: • Global electricity usage data was collected from monthly utility invoices obtained from • District heating and cooling. third-party providers. • The WRI and WBSCD issued additional guidance for Scope 2 emissions in 2015 (in GHG Protocol Scope 2 Guidance, An amendment to the GHG Protocol Corporate Standard), which sets forth reporting under both location-based and market-based methodologies, where the prior version of the GHG Protocol only addressed a location- based methodology. The location-based method applies average emission factors that correspond to the grid where the consumption occurs, whereas the market-based method applies emission factors that correspond to energy purchased through contractual instruments. Where contractual instruments were not purchased, the market-based emission factors represent either the residual mix, where available, or the location grid-average factors. This management assertion only includes Tesla’s location- based Scope 2 GHG emissions as Tesla is continuing to implement its processes to measure and report its market-based Scope 2 GHG emissions. • Emission factors: • Canada: Environment Canada. 2019 National inventory report: greenhouse gas sources and sinks in Canada. • United Kingdom (UK): UK database published by the Department for Environment Food & Rural Affairs (DEFRA) 2022. • U.S. EPA Emission Factors for Greenhouse Gas Inventories 2022. • All other countries: International Energy Agency (IEA) Emissions Factors 2021. 142
Appendix Except as otherwise noted, this report covers Tesla, Inc.’s fiscal year 2021, and references to “to date,” “currently,” or similar expressions reflect information as of December 31, 2021. Our data and methodologies have been collected and reviewed internally using relevant scientific and technical methodologies. Our statements about past occurrences and potential future development are based on data, estimates and assumptions made as of the date of publication. Certain information and data in this report may come from third-party sources and operations outside of our control. Tesla’s ESG Sustainability Council actively reviews and updates our methodologies for calculating the metrics set forth in this report. From time to time, data reported for prior periods may change due to improvement in data collection and measurement, new data availability, methodological adjustments or activities related to mergers and acquisitions, and we reserve the right to revisit our prior historical data and estimates to ensure accuracy and make any necessary corrections to our public reporting. Tesla holds no obligation to update any information or statements in this report. Forward-Looking Statements Certain statements in this report, including statements relating to future product development, performance and capability, timelines for the building of new factories and opening of new locations, expected cost savings from local manufacturing and materials recycling operations, the expansion of our Supercharger Network, future environmental sustainability efforts and expected efficiencies, data collection and reporting of results in subsequent Impact Reports are forward-looking statements that are subject to risks and uncertainties. These forward-looking statements are based on management’s current expectations. Various important factors could cause actual results to differ materially, including the risks identified in our U.S. Securities and Exchange Commission (“SEC”) filings and reports, including the risks identified under the section captioned “Risk Factors” in our quarterly report on Form 10-Q filed with the SEC on July 27, 2021 . Tesla disclaims any obligation to update any forward-looking statement contained in this report. 143
144