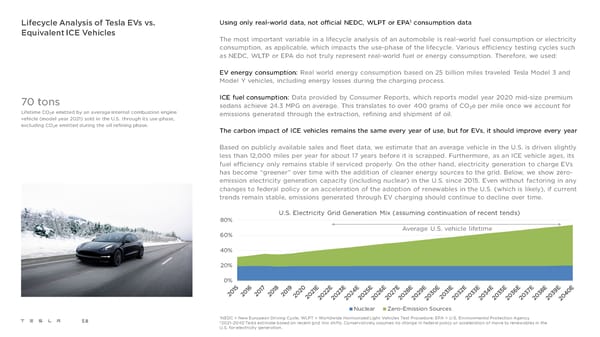
1 Lifecycle Analysis of Tesla EVs vs. Using only real-world data, not official NEDC, WLPT or EPA consumption data Equivalent ICE Vehicles The most important variable in a lifecycle analysis of an automobile is real-world fuel consumption or electricity consumption, as applicable, which impacts the use-phase of the lifecycle. Various efficiency testing cycles such as NEDC, WLTP or EPA do not truly represent real-world fuel or energy consumption. Therefore, we used: EV energy consumption: Real world energy consumption based on 25 billion miles traveled Tesla Model 3 and Model Y vehicles, including energy losses during the charging process. 70 tons ICE fuel consumption: Data provided by Consumer Reports, which reports model year 2020 mid-size premium sedans achieve 24.3 MPG on average. This translates to over 400 grams of CO2e per mile once we account for Lifetime CO e emitted by an average internal combustion engine 2 emissions generated through the extraction, refining and shipment of oil. vehicle (model year 2021) sold in the U.S. through its use-phase, excluding CO2e emitted during the oil refining phase. The carbon impact of ICE vehicles remains the same every year of use, but for EVs, it should improve every year Based on publicly available sales and fleet data, we estimate that an average vehicle in the U.S. is driven slightly less than 12,000 miles per year for about 17 years before it is scrapped. Furthermore, as an ICE vehicle ages, its fuel efficiency only remains stable if serviced properly. On the other hand, electricity generation to charge EVs has become “greener” over time with the addition of cleaner energy sources to the grid. Below, we show zero- emission electricity generation capacity (including nuclear) in the U.S. since 2015. Even without factoring in any changes to federal policy or an acceleration of the adoption of renewables in the U.S. (which is likely), if current trends remain stable, emissions generated through EV charging should continue to decline over time. U.S. Electricity Grid Generation Mix (assuming continuation of recent tends) 80% Average U.S. vehicle lifetime 60% 40% 20% 0% Nuclear Zero-Emission Sources 58 1NEDC = New European Driving Cycle; WLPT = Worldwide Harmonized Light Vehicles Test Procedure; EPA = U.S. Environmental Protection Agency 22021-2040 Tesla estimate based on recent grid mix shifts. Conservatively assumes no change in federal policy or acceleration of move to renewables in the U.S. for electricity generation.
 Tesla 2021 Impact Report Page 57 Page 59