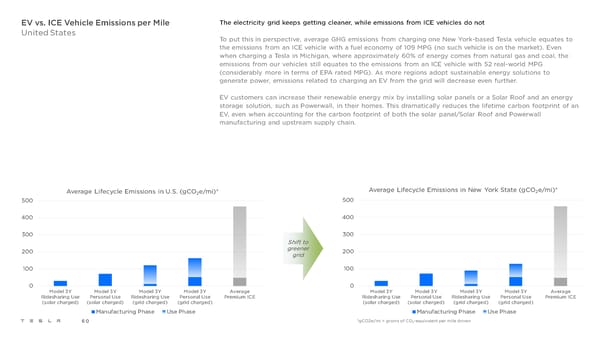
EV vs. ICE Vehicle Emissions per Mile The electricity grid keeps getting cleaner, while emissions from ICE vehicles do not United States To put this in perspective, average GHG emissions from charging one New York-based Tesla vehicle equates to the emissions from an ICE vehicle with a fuel economy of 109 MPG (no such vehicle is on the market). Even when charging a Tesla in Michigan, where approximately 60% of energy comes from natural gas and coal, the emissions from our vehicles still equates to the emissions from an ICE vehicle with 52 real-world MPG (considerably more in terms of EPA rated MPG). As more regions adopt sustainable energy solutions to generate power, emissions related to charging an EV from the grid will decrease even further. EV customers can increase their renewable energy mix by installing solar panels or a Solar Roof and an energy storage solution, such as Powerwall, in their homes. This dramatically reduces the lifetime carbon footprint of an EV, even when accounting for the carbon footprint of both the solar panel/Solar Roof and Powerwall manufacturing and upstream supply chain. Average Lifecycle Emissions in U.S. (gCO2e/mi)* Average Lifecycle Emissions in New York State (gCO2e/mi)* 500 500 400 400 300 300 Shift to 200 greener 200 grid 100 100 0 0 Model 3Y Model 3Y Model 3Y Model 3Y Average Model 3Y Model 3Y Model 3Y Model 3Y Average Ridesharing Use Personal Use Ridesharing Use Personal Use Premium ICE Ridesharing Use Personal Use Ridesharing Use Personal Use Premium ICE (solar charged) (solar charged) (grid charged) (grid charged) (solar charged) (solar charged) (grid charged) (grid charged) Manufacturing Phase Use Phase Manufacturing Phase Use Phase *gCO2e/mi = grams of CO -equivalent per mile driven 60 2
 Tesla 2021 Impact Report Page 59 Page 61