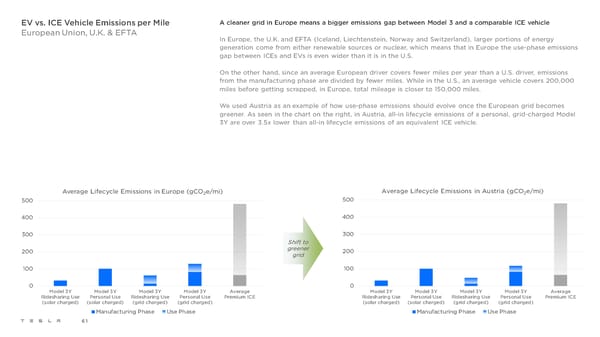
EV vs. ICE Vehicle Emissions per Mile A cleaner grid in Europe means a bigger emissions gap between Model 3 and a comparable ICE vehicle European Union, U.K. & EFTA In Europe, the U.K. and EFTA (Iceland, Liechtenstein, Norway and Switzerland), larger portions of energy generation come from either renewable sources or nuclear, which means that in Europe the use-phase emissions gap between ICEs and EVs is even wider than it is in the U.S. On the other hand, since an average European driver covers fewer miles per year than a U.S. driver, emissions from the manufacturing phase are divided by fewer miles. While in the U.S., an average vehicle covers 200,000 miles before getting scrapped, in Europe, total mileage is closer to 150,000 miles. We used Austria as an example of how use-phase emissions should evolve once the European grid becomes greener. As seen in the chart on the right, in Austria, all-in lifecycle emissions of a personal, grid-charged Model 3Y are over 3.5x lower than all-in lifecycle emissions of an equivalent ICE vehicle. Average Lifecycle Emissions in Europe (gCO2e/mi) Average Lifecycle Emissions in Austria (gCO2e/mi) 500 500 400 400 300 300 Shift to 200 greener 200 grid 100 100 0 0 Model 3Y Model 3Y Model 3Y Model 3Y Average Model 3Y Model 3Y Model 3Y Model 3Y Average Ridesharing Use Personal Use Ridesharing Use Personal Use Premium ICE Ridesharing Use Personal Use Ridesharing Use Personal Use Premium ICE (solar charged) (solar charged) (grid charged) (grid charged) (solar charged) (solar charged) (grid charged) (grid charged) Manufacturing Phase Use Phase Manufacturing Phase Use Phase 61
 Tesla 2021 Impact Report Page 60 Page 62