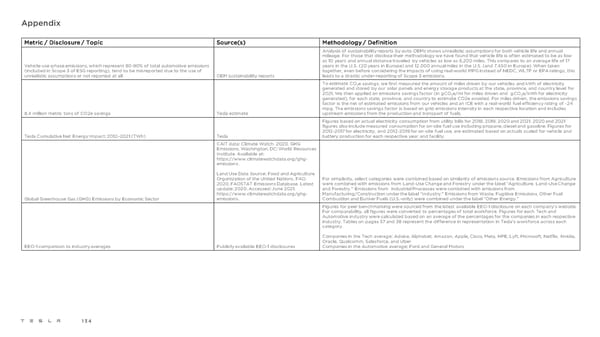
Appendix Metric / Disclosure / Topic Source(s) Methodology / Definition Analysis of sustainability reports by auto OEMs shows unrealistic assumptions for both vehicle life and annual mileage. For those that disclose their methodology we have found that vehicle life is often estimated to be as low as 10 years and annual distance traveled by vehicles as low as 6,200 miles. This compares to an average life of 17 Vehicle use-phase emissions, which represent 80-90% of total automotive emissions years in the U.S. (20 years in Europe) and 12,000 annual miles in the U.S. (and 7,450 in Europe). When taken (included in Scope 3 of ESG reporting), tend to be misreported due to the use of together, even before considering the impacts of using real-world MPG instead of NEDC, WLTP or EPA ratings, this unrealistic assumptions or not reported at all. OEM sustainability reports leads to a drastic under-reporting of Scope 3 emissions. To estimate CO e savings, we first measured the amount of miles driven by our vehicles and kWh of electricity 2 generated and stored by our solar panels and energy storage products at the state, province, and country level for 2021. We then applied an emissions savings factor (in gCO e/mi for miles driven and gCO e/kWh for electricity 2 2 generated), for each state, province, and country to estimate CO2e avoided. For miles driven, the emissions savings factor is the net of estimated emissions from our vehicles and an ICE with a real-world fuel efficiency rating of ~24 mpg. The emissions savings factor is based on grid emissions intensity in each respective location and includes 8.4 million metric tons of CO2e savings Tesla estimate upstream emissions from the production and transport of fuels. Figures based on actual electricity consumption from utility bills for 2018, 2019, 2020 and 2021. 2020 and 2021 figures also include measured consumption for on-site fuel use including propane, diesel and gasoline. Figures for 2012-2017 for electricity, and 2012-2019 for on-site fuel use, are estimated based on actuals scaled for vehicle and Tesla Cumulative Net Energy Impact: 2012–2021 (TWh) Tesla battery production for each respective year and facility. CAIT data: Climate Watch. 2020. GHG Emissions. Washington, DC: World Resources Institute. Available at: https://www.climatewatchdata.org/ghg- emissions. Land Use Data Source: Food and Agriculture Organization of the United Nations. FAO For simplicity, select categories were combined based on similarity of emissions source. Emissions from Agriculture 2020, FAOSTAT Emissions Database. Latest were combined with emissions from Land-Use Change and Forestry under the label “Agriculture, Land-Use Change update: 2020. Accessed: June 2021. and Forestry.” Emissions from Industrial Processes were combined with emissions from https://www.climatewatchdata.org/ghg- Manufacturing/Construction under the label “Industry.” Emissions from Waste, Fugitive Emissions, Other Fuel Global Greenhouse Gas (GHG) Emissions by Economic Sector emissions. Combustion and Bunker Fuels (U.S.-only) were combined under the label “Other Energy.” Figures for peer benchmarking were sourced from the latest available EEO-1 disclosure on each company’s website. For comparability, all figures were converted to percentages of total workforce. Figures for each Tech and Automotive industry were calculated based on an average of the percentages for the companies in each respective industry. Tables on pages 37 and 38 represent the difference in representation in Tesla’s workforce across each category. Companies in the Tech average: Adobe, Alphabet, Amazon, Apple, Cisco, Meta, HPE, Lyft, Microsoft, Netflix, Nvidia, Oracle, Qualcomm, Salesforce, and Uber EEO-1 comparison to industry averages Publicly available EEO-1 disclosures Companies in the Automotive average: Ford and General Motors 134
 Tesla 2021 Impact Report Page 133 Page 135