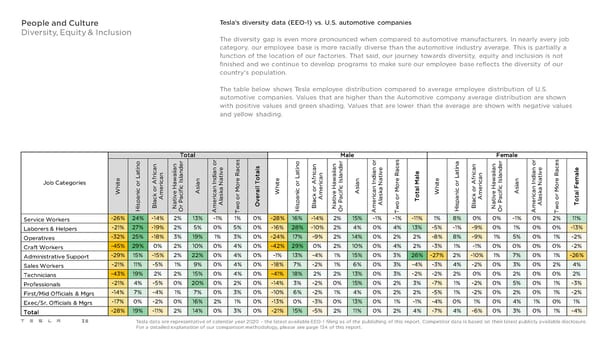
People and Culture Tesla’s diversity data (EEO-1) vs. U.S. automotive companies Diversity, Equity & Inclusion The diversity gap is even more pronounced when compared to automotive manufacturers. In nearly every job category, our employee base is more racially diverse than the automotive industry average. This is partially a function of the location of our factories. That said, our journey towards diversity, equity and inclusion is not finished and we continue to develop programs to make sure our employee base reflects the diversity of our country's population. The table below shows Tesla employee distribution compared to average employee distribution of U.S. automotive companies. Values that are higher than the Automotive company average distribution are shown with positive values and green shading. Values that are lower than the average are shown with negative values and yellow shading. Total r s Male r s Female r s o r o e o r o e a r o e in n e c in n e c in n e c a an d n e ls a an d n e t a and n e e t i a t i a i a ic i n a v a ic i n a v e a ic i n a v a r n a la i i R t a r n a la i i R r n a la i i R al e L f a s n at e o e L f a s n at e al e L f a s n at e m Job Categories r ic aw I nd r ic aw I nd r ic awI nd e it A r ia I N or it Ar ia I N or M it o Ar ia I N or h o r e H ic s n a ll T h o r e H ic s n a al h ic r e Hic s n a F W ic o m e if A a k M a W ic om e if A a k M t W om e if A a k M n k c c r n k c c n k c c al v i e v i o v i t a c A i a r as or a c A i a r as or a c A i a r as or p la at P e l o v p la at P e l o T p la at P e l o o is B N r m A w O is B N r m A w is B N r m A w T H O A T H O A T H O A T Service Workers -26% 24% -14% 2% 13% -1% 1% 0% -28% 16% -14% 2% 15% -1% -1% -11% 1% 8% 0% 0% -1% 0% 2% 11% Laborers & Helpers -21% 27% -19% 2% 5% 0% 5% 0% -16% 28% -10% 2% 4% 0% 4% 13% -5% -1% -9% 0% 1% 0% 0% -13% Operatives -32% 25% -18% 3% 19% 1% 3% 0% -24% 17% -9% 2% 14% 0% 2% 2% -8% 8% -9% 1% 5% 0% 1% -2% Craft Workers -45% 29% 0% 2% 10% 0% 4% 0% -42% 29% 0% 2% 10% 0% 4% 2% -3% 1% -1% 0% 0% 0% 0% -2% Administrative Support -29% 15% -15% 2% 22% 0% 4% 0% -1% 13% -4% 1% 15% 0% 3% 26% -27% 2% -10% 1% 7% 0% 1% -26% Sales Workers -21% 11% -5% 1% 9% 0% 4% 0% -18% 7% -2% 1% 6% 0% 3% -4% -3% 4% -2% 0% 3% 0% 2% 4% Technicians -43% 19% 2% 2% 15% 0% 4% 0% -41% 18% 2% 2% 13% 0% 3% -2% -2% 2% 0% 0% 2% 0% 0% 2% Professionals -21% 4% -5% 0% 20% 0% 2% 0% -14% 3% -2% 0% 15% 0% 2% 3% -7% 1% -2% 0% 5% 0% 1% -3% First/Mid Officials & Mgrs -14% 7% -4% 1% 7% 0% 3% 0% -10% 6% -2% 1% 4% 0% 2% 2% -5% 1% -2% 0% 2% 0% 1% -2% Exec/Sr. Officials & Mgrs -17% 0% -2% 0% 16% 2% 1% 0% -13% 0% -3% 0% 13% 0% 1% -1% -4% 0% 1% 0% 4% 1% 0% 1% Total -28% 19% -11% 2% 14% 0% 3% 0% -21% 15% -5% 2% 11% 0% 2% 4% -7% 4% -6% 0% 3% 0% 1% -4% 38 Tesla data are representative of calendar year 2020 – the latest available EEO-1 filing as of the publishing of this report. Competitor data is based on their latest publicly available disclosure. For a detailed explanation of our comparison methodology, please see page 134 of this report.
 Tesla 2021 Impact Report Page 37 Page 39