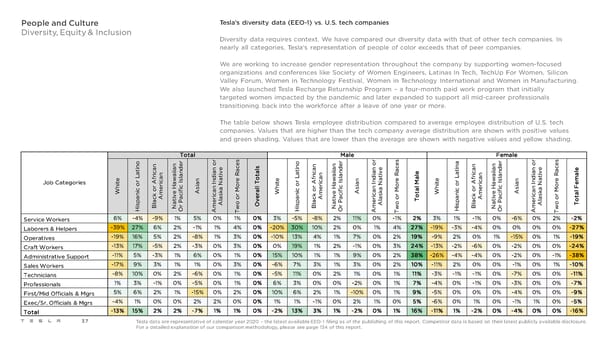
People and Culture Tesla’s diversity data (EEO-1) vs. U.S. tech companies Diversity, Equity & Inclusion Diversity data requires context. We have compared our diversity data with that of other tech companies. In nearly all categories, Tesla’s representation of people of color exceeds that of peer companies. We are working to increase gender representation throughout the company by supporting women-focused organizations and conferences like Society of Women Engineers, Latinas In Tech, TechUp For Women, Silicon Valley Forum, Women in Technology Festival, Women in Technology International and Women in Manufacturing. We also launched Tesla Recharge Returnship Program – a four-month paid work program that initially targeted women impacted by the pandemic and later expanded to support all mid-career professionals transitioning back into the workforce after a leave of one year or more. The table below shows Tesla employee distribution compared to average employee distribution of U.S. tech companies. Values that are higher than the tech company average distribution are shown with positive values and green shading. Values that are lower than the average are shown with negative values and yellow shading. Total r s Male r s Female r s o r o e o r o e a r o e in n e c in n e c in n e c a an d n e ls a an d n e t a and n e e t i a t i a i a ic i n a v a ic i n a v e a ic i n a v a r n a la i i R t a r n a la i i R r n a la i i R al e L f a s n at e o e L f a s n at e al e L f a s n at e m Job Categories r ic aw I nd r ic aw I nd r ic awI nd e it Ar ia I N or it Ar ia I N or M it o Ar ia I N or h o r e H ic s n a ll T h o r e H ic s n a al h ic r e Hic s n a F W ic om e if A a k M a W ic om e if A a k M t W om e if A a k M n k c c r n k c c n k c c al v i e v i o v i t a c A i a r as or a c A i a r as or a c A i a r as or p la at P e l o v p la at P e l o T p la at P e l o o is B N r m A w O is B N r m A w is B N r m A w T H O A T H O A T H O A T Service Workers 6% -4% -9% 1% 5% 0% 1% 0% 3% -5% -8% 2% 11% 0% -1% 2% 3% 1% -1% 0% -6% 0% 2% -2% Laborers & Helpers -39% 27% 6% 2% -1% 1% 4% 0% -20% 30% 10% 2% 0% 1% 4% 27% -19% -3% -4% 0% 0% 0% 0% -27% Operatives -19% 16% 5% 2% -8% 1% 3% 0% -10% 13% 4% 1% 7% 0% 2% 19% -9% 2% 0% 1% -15% 0% 1% -19% Craft Workers -13% 17% -5% 2% -3% 0% 3% 0% 0% 19% 1% 2% -1% 0% 3% 24% -13% -2% -6% 0% -2% 0% 0% -24% Administrative Support -11% 5% -3% 1% 6% 0% 1% 0% 15% 10% 1% 1% 9% 0% 2% 38% -26% -4% -4% 0% -2% 0% -1% -38% Sales Workers -17% 9% 3% 1% 1% 0% 3% 0% -6% 7% 3% 1% 3% 0% 2% 10% -11% 2% 0% 0% -1% 0% 1% -10% Technicians -8% 10% 0% 2% -6% 0% 1% 0% -5% 11% 0% 2% 1% 0% 1% 11% -3% -1% -1% 0% -7% 0% 0% -11% Professionals 1% 3% -1% 0% -5% 0% 1% 0% 6% 3% 0% 0% -2% 0% 1% 7% -4% 0% -1% 0% -3% 0% 0% -7% First/Mid Officials & Mgrs 5% 6% 2% 1% -15% 0% 2% 0% 10% 6% 2% 1% -10% 0% 1% 9% -5% 0% 0% 0% -4% 0% 0% -9% Exec/Sr. Officials & Mgrs -4% 1% 0% 0% 2% 2% 0% 0% 1% 1% -1% 0% 2% 1% 0% 5% -6% 0% 1% 0% -1% 1% 0% -5% Total -13% 15% 2% 2% -7% 1% 1% 0% -2% 13% 3% 1% -2% 0% 1% 16% -11% 1% -2% 0% -4% 0% 0% -16% 37 Tesla data are representative of calendar year 2020 – the latest available EEO-1 filing as of the publishing of this report. Competitor data is based on their latest publicly available disclosure. For a detailed explanation of our comparison methodology, please see page 134 of this report.
 Tesla 2021 Impact Report Page 36 Page 38